DAS Trader Pro supported

Tradervue now supports import from DAS Trader Pro.

Two notes about this support:

1. DAS Trader Pro only allows you to export executions for the current trading day. So make sure you export before about 10pm eastern each day, or you may not be able to at all.

2. When importing into Tradervue, there is a field for “Trade date for this import” – you need to fill that in with the trade date for the imported trades. This is because DAS Trader Pro does not include the date in the exported data – only the time.

To do your import, just click on Import Trades, select DAS Trader Pro from the list, and follow the instructions.

Exporting data from Tradervue

It’s now possible to export data out of Tradervue if you’d like to keep a backup of your data, do some calculations in Excel, or whatever else you like! There are new export buttons in several places in the application; here is a screen shot of the Trades View:

If you click the export button, it will generate and download a CSV file that you can import into Excel or elsewhere. You can export from the following parts of the site:

  • The Trades View, as shown above
  • The Journal View
  • An individual trade page, to export executions

Export is available for all silver and gold subscribers.

E*Trade import now available

This one has been a long time coming…but we finally have support for E-Trade built into Tradervue.

The problem has been that there isn’t a way on the E-Trade web site to create a report that lists your trade executions in a way that includes the actual time of the execution. Hard to believe, I realize, but we even confirmed this with E-Trade support.

But, a clever Tradervue customer named Rob noticed that the trade alerts window actually contains all of the necessary information (thanks Rob!). So, you can import all of your trades back to the last time you cleared your alerts.

So, to import from E-Trade, just select it from the drop-down list on the Import Trades page, and follow the instructions shown.

New Dashboard

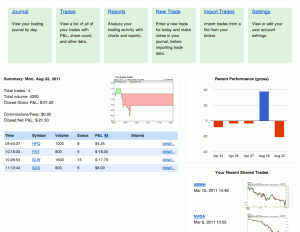
Also new in the recent Tradervue update was an all-new Dashboard, which is the default page you’ll see after logging in.

At a glance you’ll see your most recent trading day details, your overall performance for the last week (or the last 5 trading days), and your most recent shared trades with comment notifications.

Even better, if someone else has been trading the same instruments you have, and they have shared a trade, you’ll see that on your dashboard as well:

It looks at your last two trading days, and alerts you if there are shared trades in the same symbols on the same days.

Performance by Tag Report

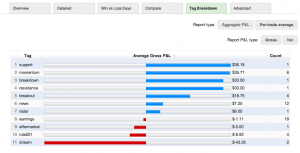
Another of the new reports introduced last week is the Tag Breakdown report. Here’s an example:

It shows you each of your tags, along with the number of trades using that tag and the total or average P&L for each of them.

If you’re using tags for the setups you’re trading, for example, then it’s easy to see very quickly which setups are working this week, and which ones aren’t. I’ve spoken to several folks who have sometimes been surprised; they thought a setup was working ok, but in reality it was responsible for the largest losses of the week/month/etc. When combined with the trade filter, this new report makes that information quickly available.

The tag report is available to all silver and gold subscribers.

Day Type report

Another report added recently to the Detailed Reports tab, available for all users, is the Day Type report. Here’s an example:

This shows your trading performance based on the type of movement in the overall market that day, be it trend day, range day, etc.

For clarification, here are the definitions Tradervue uses for the different day types:

Inside Range day – all trading was within yesterday’s price range

Trend Up day – closes above yesterday’s high, opens in bottom 15% of day’s range, and closes in top 15% of day’s range

Trend Down day – opposite of trend up day

Outside Range day – trades at least partially outside yesterday’s range, but was not a trend day

This report may offer some unexpected insights into your trading!

New Reports

With last week’s update, there is a new set of reports under the “Advanced” tab in the Reports View, for silver and gold subscribers. These new reports are:

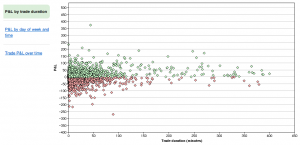
P&L by trade duration

This report plots all of your trades matching the current filter, by the duration of the trade. An easy way to tell, for example, if the trades you are holding longer are performing better.

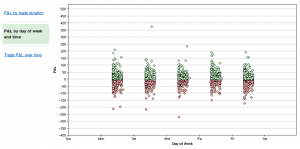
P&L by day of week and time

This report plots your trades matching the current filter against the day of week and time of day they were placed. This one is particular interesting for folks trading futures, not necessarily limited to the regular daily trading session.

Trade P&L over time

This report plots your trades matching the current filter against the date and time they were opened. You can look at an overview as shown above, or zoom into just a single day or week and see your trades based on time of day.

There will be more of these types of reports coming – let us know if you have ideas as to what you’d like to see!

Chart studies and comparisons

With this week’s release, Tradervue now supports adding studies and comparisons to the auto-generated price charts for silver and gold subscribers. If you normally use, say, an EMA(20) on the 5-minute chart when you’re trading, then you can see the same in your journal when you’re reviewing later.

Here are a few examples of the new studies in action:
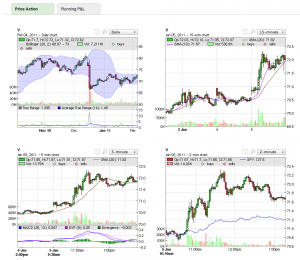
The supported studies include:

  • Exponential Moving Average
  • Simple Moving Average
  • Bollinger Bands
  • Donchian Channels
  • Average True Range
  • MACD
  • RSI
  • Fast and Slow Stochastics

If there are studies you need, but they’re not on the list, let us know and we can likely get them added for you.

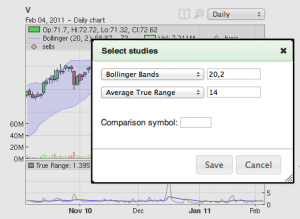
If you click the study icon above each chart (next to the zoom icon), you’ll see the study editor for that chart, where you can choose studies and edit parameters:
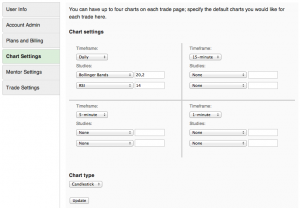
You can also set studies in your chart defaults, so all of your trades will start out with the same set of information. To do that, go to your account settings (either from the dashboard, or click your user name in the header), then click the Chart Settings tab:
You may have also noticed in the pictures above that comparison charts are also supported; if you want to see, for example, how SPY is moving compared to the stock you’re trading, you can do that:
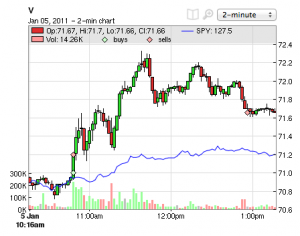
The price for the comparison symbol is normalized to the symbol you’re comparing it to, so they will fit nicely on the same chart. You can use the comparisons with markets, sectors, other stocks/futures, or whatever you like!