Display charts for any execution

One of the most popular features of Tradervue is the way price charts are auto-generated for all of your trades, showing all of your buys and sells during the trade. You can choose any timeframe you like for up to 4 charts on each trade, and they will all show your executions.

In some cases, however, you can’t see all of the executions you want on a chart of a specific timeframe. For example, if you have a trade that lasts for 6 hours, you can’t show both the entry and exit on a 1-min chart. Or if you have a trade that lasts a month, you can’t see a 5-min chart of your entry – you’ll only see it for your exit.

Today, all that changes! You can now see any execution on any timeframe.

Let’s look at an example. Here is a daily chart for an option trade that was open for about a month:

You can see both the entries and the exits. Here’s the 15-min chart for that trade:

In this case, we only see the closing executions, as the chart would have to be quite large to show both entries and exits on a 15-min timeframe for a month-long trade.

But sometimes we want to see that chart at the entry time. Now, you can click “Advanced” in the trade detail view:

You’ll now see chart symbols next to each execution:

If we click on one of them:

All of the price charts for the trade are now shifted in time to show that execution, and it will be highlighted in yellow on each. Here’s a closer look at the 15-min chart from above, where you can see the selected opening sell is now visible, and highlighted in yellow:

As with any other chart, you can zoom in on any of these, or view them in large mode. This works for any trade, on any timeframe, starting today!

Open Trades now available on Dashboard

Tradervue will now display all open trades on your Dashboard:

This is useful for those who make multi-day swing or long-term trades. But even if you’re trading intraday, it’s a handy way to quickly see if any of your trades are showing as open, often indicating missing executions that you may not have imported.

The “Open Trades” box on the Dashboard will not display if you don’t have any open trades, so we won’t take up any extra space if it’s not necessary.

The columns are customizable, and are saved separately from the columns you’ve chosen in the Trades View, Journal View, and the current day summary on the Dashboard.

And if you’d rather not see this on the Dashboard, you can customize the information displayed:

The Open Trades box has been added for all users, even if you have previously customized your Dashboard.

MFE/MAE/Exit statistics in R

If you’re tracking your risk in Tradervue, you’ve always been able to view your P&L, as well as all of the reports, in terms of R.

We now also display Position MFE/MAE and Best Exit P&L in terms of R as well, if you have set an initial risk value for the trade. Here’s an example of how this looks:

If you don’t have a risk value set for the trade, you’ll still see these statistics as before, they just won’t be shown in R.

TradeStation liquidity data

If you’re using TradeStation, and you’d like to use the liquidity reporting in Tradervue, you can now do that if you’re using unbundled pricing from TradeStation.

In TradeStation’s TradeManager, just add the “Unbundled Route Fees” column to the Orders tab, prior to copying your data. As a reminder, a note about this appears on the Tradervue Import Trades page as well after you select TradeStation.

This is only available when using unbundled pricing at TradeStation – if you are on per-trade, or flat per-share pricing, the necessary data is unavailable.

Advanced Reports – drawdown (MAE)

We’ve added Quick Report presets for a couple of popular reports on the Advanced Reports tab that we often get questions about.

Trade drawdown in R

This one shows Position MAE, otherwise known as drawdown, plotted in terms of R:

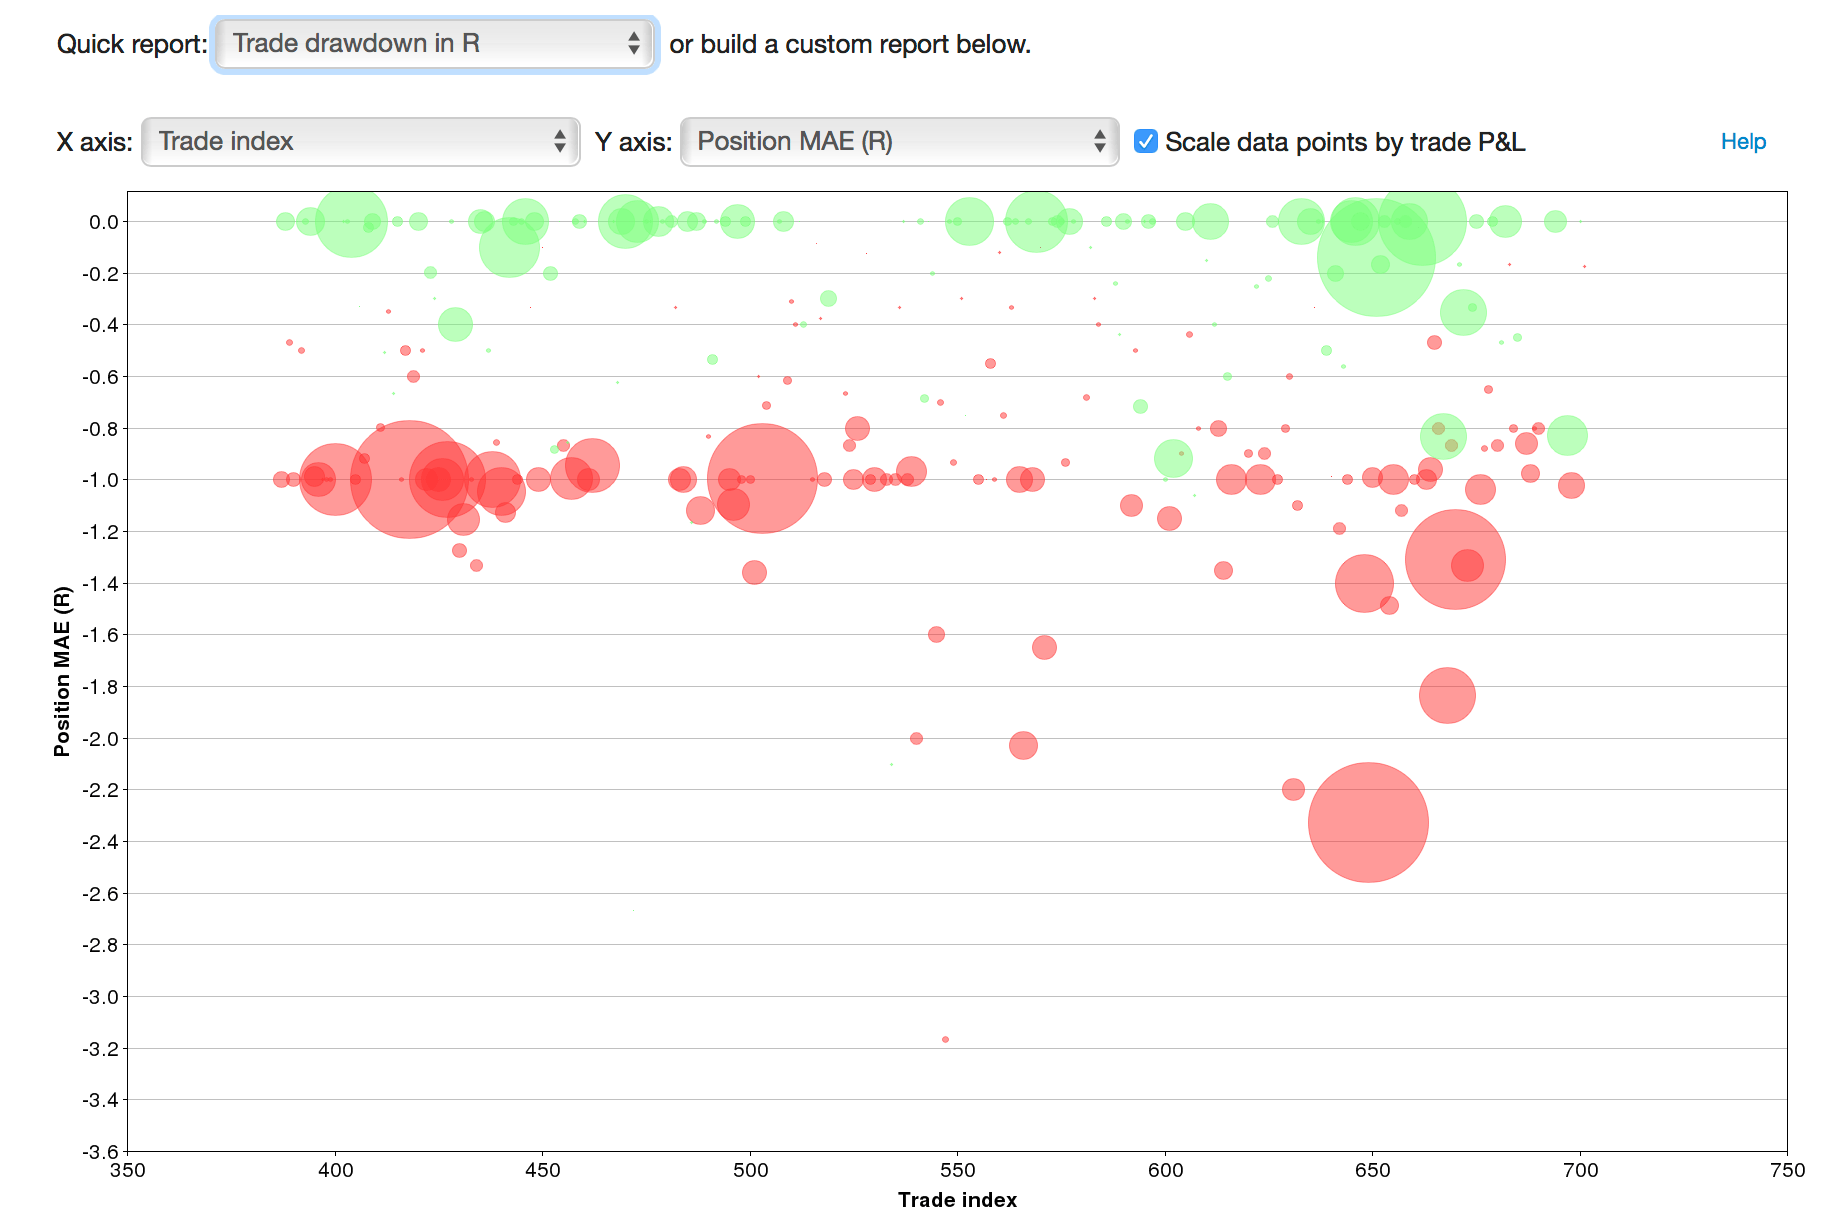
The X axis here is just an index, meaning the trades on the chart are spread out across the X axis.

Let’s think through this. R is the maximum risk you indicated you would allow in a trade. So if we see trades with a drawdown beyond -1.0R, that means you may not have honored your stop, and perhaps broke one of your trading rules.

The size of the bubbles are proportional to their P&L – so large red bubbles have a larger loss. However, seeing smaller dots (or even green dots) below the -1.0 line in this case isn’t necessarily a good thing – in all of these cases, you let your loss in the trade run in excess of your predefined max risk.

Trade drawdown – stop analysis

Here, we look at Position MAE, in $ terms:

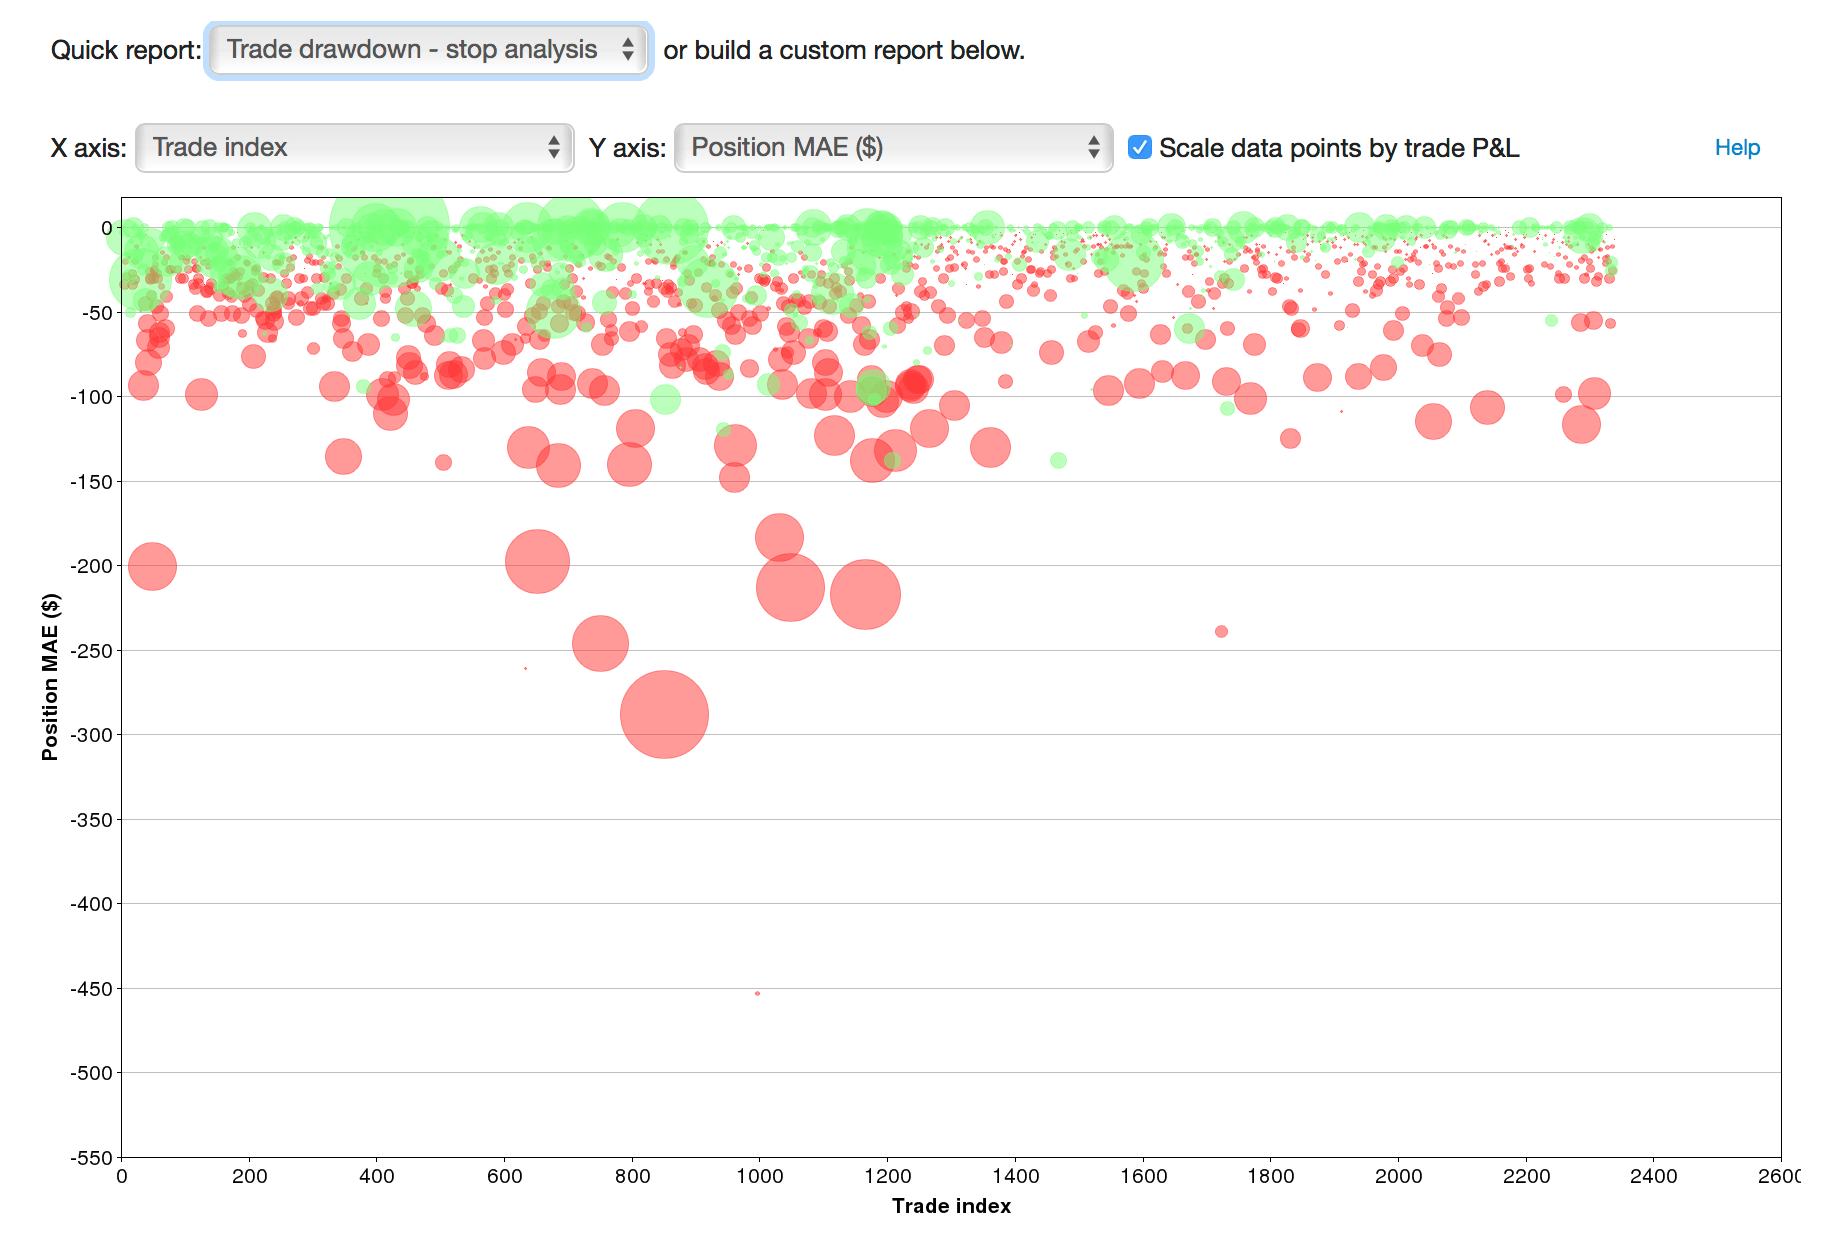
We’ve looked at this report before, but it’s now much easier to get to.

In the example here, we can see that any trade that ran against us more than $150 ended up being a loser. And in fact, almost all of the trades that ran more than $100 against us ended up losing, with few (and small) exceptions. So, we can say from the data that for the trades where we had looser stops, had we used a tighter stop of $100 (or $150), we would have done better overall.

Armed with this knowledge, we can now dive into the data and do some further analysis.

And more…

There are hundreds of possibilities you can look at in the advanced reports – definitely experiment with them, and see your data in a different light. For example, here we’re looking at Position MAE in R, plotted against our R in $:

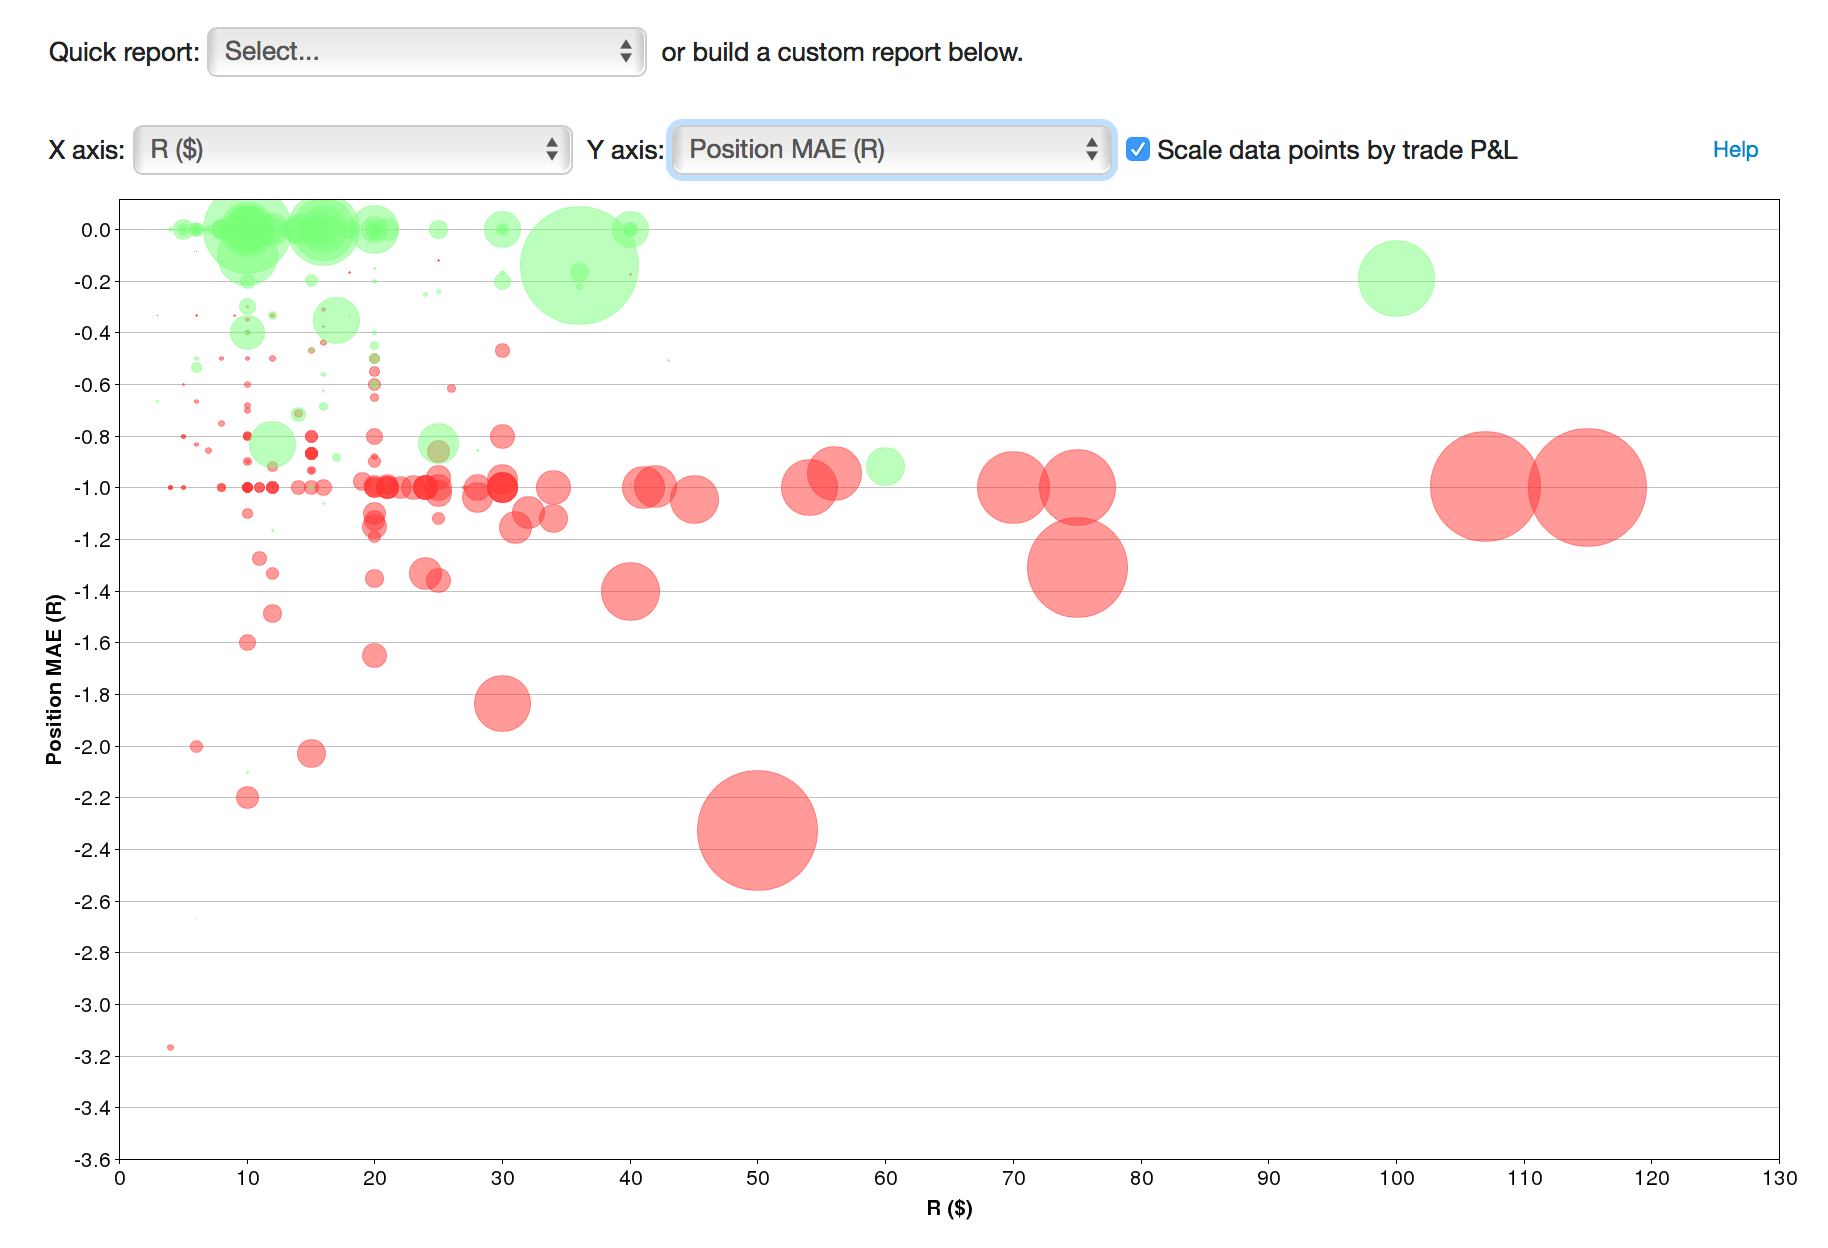
It’s similar to the first report, but a bit of a different view. We can see the trades that we let run below -1.0R as before, but now we can see just how big our R value was for each of those trades. So here, we can see that for R values over $60, we generally respected our stops; for R values below that, we often exceeded the amount of risk we had planned.