Market behavior report updates

The Market Behavior reports are designed to show your trading performance against what the overall market is doing; it’s shown based on market movement, gap, and day type:

Tradervue___Reports

We’ve always used the SPY ETF as a proxy for market performance. But as you know, not all markets move the same, and many users have asked to be able to compare to different markets. So today, we have added the ability to select which market proxy you would like to use for these reports:

Tradervue___Reports

Currently in the list are:

  • SPY
  • QQQ
  • IWM
  • XLF
  • GLD
  • USO
  • VXX

These reports are interactive, and what’s really special is you can stack filters from different markets together.  For example, you can create a filter to show trades made on days where the QQQ gapped down over 2%, and the VXX closed up over 2%:

Tradervue___Trades

These new additions are available today for all silver and gold subscribers. Free subscribers will continue to have access to a non-interactive SPY-only version of the report.

Recent P&L chart now interactive

The new Recent report group on the Overview reports has been very popular since its introduction a couple of months ago.

Today, we have improved them by making the 30-day P&L chart interactive. You can now click on a bar for a specific day, and automatically filter your trades down to just that day so you can quickly investigate them in more detail:

recent_interactive

While most of the interactive reports in Tradervue require a silver or gold subscription, this one is enabled for all users!

New video on interactive reports

We’ve uploaded a video on using the new interactive reports. We walk through the trading for one particular trader, and analyze his trading performance when trading on the market open. In this particular case, we find that on Mondays at the open his performance is much better than other days, and we further look into whether aggressively opening positions (e.g. removing liquidity) is the winning strategy for this trader.

See the 3-minute video here: Using the Interactive Reports

And don’t miss the other videos, including a 6-minute getting started with Tradervue video; you can find them all at Tutorials and Help Videos!

Market movement reports are now interactive

Following up on the recent changes to allow drill-down into reports data, we have added this same capability to the market movement reports! That means, for example, when you’re looking at the Day Type report:

You can now click on a specific market day type, such as “Trend down”, and analyze only the trades you made on days where the market was in a trend-down day.

For a refresher on how Tradervue defines the different day types, see this post.

New interactive reports

Tradervue has always offered powerful filtering capability, allowing you to narrow down your trades to just the ones you want to see and analyze. Today, we’ve made this dramatically more powerful by adding the ability to drill down from the detailed reports to refine your filter.

Now, from the detailed reports tab, you can click on the bars in the report charts, and the current trade filter will be narrowed to just the trades making up that bar. For example, suppose you’re looking at the Days/Times group in the Detailed report, and you see the Performance by Day of Week chart:

Monday looks like it’s been a good day; if you click on the blue “Mon” bar, you’ll be able to narrow down your trades:

Click OK, and you’ll only see trades from Mondays:

The Day of Week report is certainly less interesting now, but let’s now look at the Performance by Hour of Day report – remember we’re only looking at trades from Mondays, and breaking them down by hour of day:

We could now click on the 9:00 bar, to filter by only trades on Mondays in the 9:00 hour.

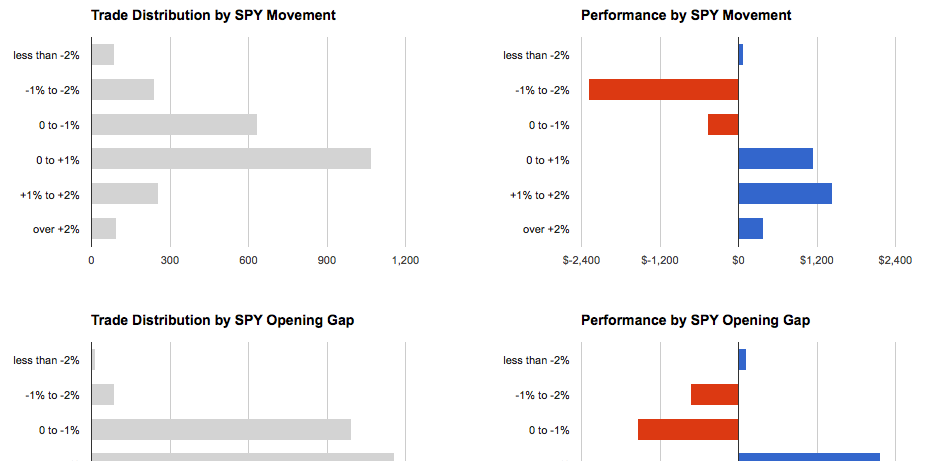
With this new filter active, we’ll go over to the Market Behavior group, and we can see that we’re historically profitable no matter what the market conditions, on Mondays in the 9:00 hour:

Compare that with the overall performance (all of our trades) based on market movement:

And we can see that we are indeed doing something different on Mondays on the open. We can now use any of the other reports, or even look more closely at the individual trades, and analyze what we’re doing differently on those first trades of the week.

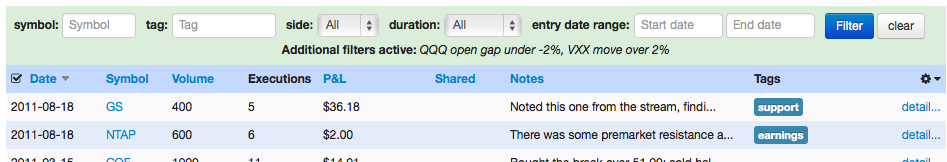
When we have filters active that aren’t normally exposed from the global filter bar, we’ll see the green bar expand and show us the additional filters we’re using:

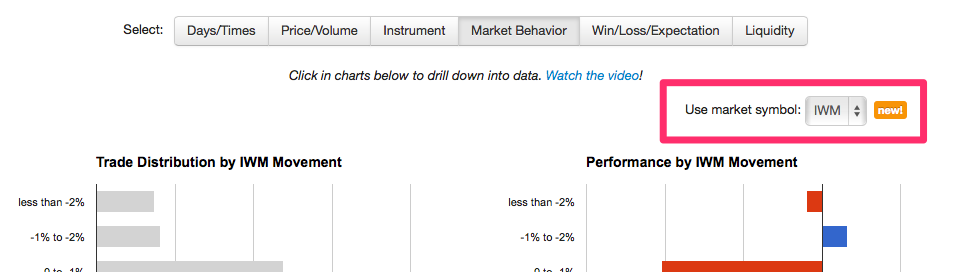
It’s not just days and times; this works with the Instrument/Price/Volume, Days/Times, Market Behavior, and Liquidity groups on the Detailed reports tab. It also works on the Compare tab. And when you click in one of the reports, the new filter is additive to the existing filter – so you can refine your filter as you go.

This is quite powerful – give it a try with your own trading data, and see what you can uncover!

Interactive reports are available for all silver and gold subscribers.

UPDATE: the Market Behavior report groups now support interactive drill-down as well!