
We’ve added the K-ratio (also known as the Zephyr k-ratio) to Tradervue’s statistics tables.
K-ratio is a return vs. risk ratio. Imagine your cumulative P&L plotted, with the x-axis being the trade number (starting from 1, sorted by date/time), and the Y-axis as cumulative P&L. Now imagine a best-fit line plotted drawn over this chart:
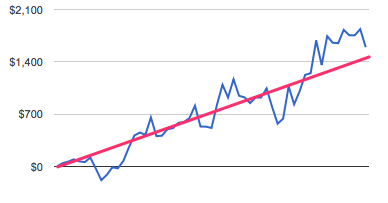
The k-ratio is the slope of this line divided by the standard error of the line. K-ratio will increase as the slope increases (cumulative P&L increasing faster), but will decrease with outsized gains or losses (indicating inconsistency).
A higher k-ratio indicates a higher positive consistency in trading performance. A ratio higher than 2.0 or so is generally considered good.
As with all Tradervue statistics, you can compare k-ratio between two different trading systems, for example, using the Compare reports.
K-ratio is available today for Gold subscribers, and is shown in the statistics tables on the Detailed, Compare, and Win vs Loss Days reports tabs.