View times of MFE/MAE

When viewing a trade, you can see the position and price excursion data (MFE and MAE) right below the execution list for the trade, as described in MFE and MAE calculations. This data can be extremely useful for seeing your maximum interim profit or loss in the trade, and in aggregate can be very useful for analyzing stops.

Today, we have added the ability to see exactly when the MFE/MAE occurred in a trade. Simply hover your cursor over the MFE or MAE value you’re interested in, and you’ll see a small popup with the timestamp it happened at:

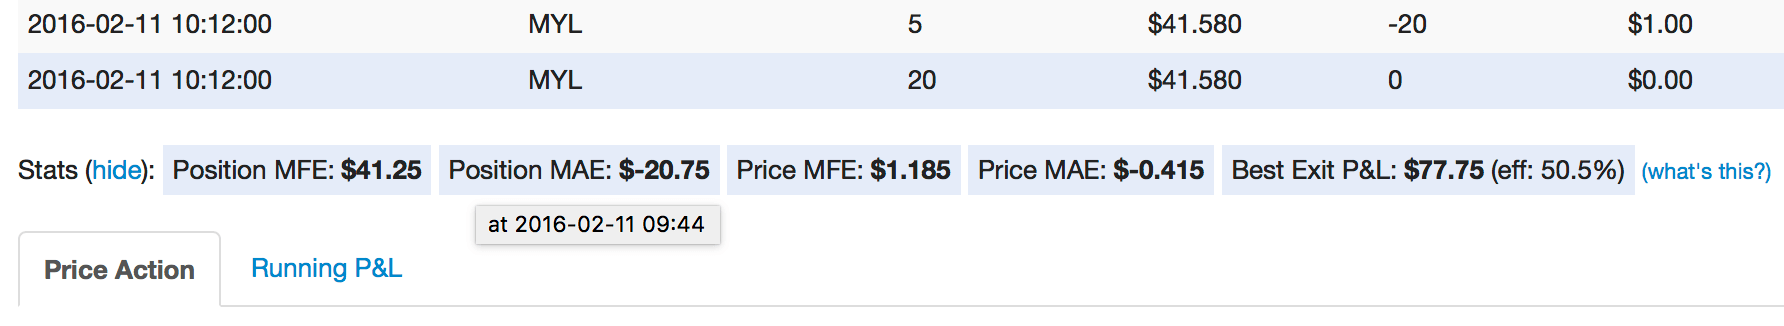
Especially when looking at position MFE/MAE, it’s not always obvious on the price chart where this occurs, if you’re scaling in and out of a trade. Having the timestamp quickly accessible makes it much easier to find!

MFE/MAE data is available for all silver and gold subscribers.

K-ratio calculation added

We’ve added the K-ratio (also known as the Zephyr k-ratio) to Tradervue’s statistics tables.

K-ratio is a return vs. risk ratio. Imagine your cumulative P&L plotted, with the x-axis being the trade number (starting from 1, sorted by date/time), and the Y-axis as cumulative P&L. Now imagine a best-fit line plotted drawn over this chart:

Tradervue___Reports

The k-ratio is the slope of this line divided by the standard error of the line. K-ratio will increase as the slope increases (cumulative P&L increasing faster), but will decrease with outsized gains or losses (indicating inconsistency).

A higher k-ratio indicates a higher positive consistency in trading performance. A ratio higher than 2.0 or so is generally considered good.

As with all Tradervue statistics, you can compare k-ratio between two different trading systems, for example, using the Compare reports.

K-ratio is available today for Gold subscribers, and is shown in the statistics tables on the Detailed, Compare, and Win vs Loss Days reports tabs.

Significance test for trading results

In chapter 12 of his excellent book The Art & Science of Technical Analysis, Adam Grimes discusses a few ways to statistically analyze your trading results. One particular calculation, the p-value, is a significance test (known as a one-tailed t-test) for the average P&L of a set of trades being greater 0. Essentially, it’s calculating the probability that your trading results could have just been due to random chance.

Tradervue now includes this calculation in the stats tables, on the Detailed, Win vs. Loss days, and Compare tabs. In the tables, it’s referred to as “Probability of random chance”, and is expressed as a percentage. Lower numbers are better – they indicate the results are less likely to be random.

If you use this calculation in conjunction with trade filters, you’ll be able to quickly calculate this for any group of trades. And if you use the Compare reports, you could compare any two groups of trades – so if you’re using tags for trading strategies, for example, you could see the difference between those two strategies.

This new statistic is available now for all users with a Gold subscription plan.

SQN calculation

If you’ve worked with Dr. Van Tharp, or read his books, you’ve undoubtedly seen what he refers to as the System Quality Number. It’s essentially a proprietary measure of the quality of a trading system, and can be roughly interpreted as follows:

  • 1.6 – 1.9 Poor, but tradeable
  • 2.0 – 2.4 Average
  • 2.5 – 2.9 Good
  • 3.0 – 4.9 Excellent
  • 5.0 – 6.9 Superb
  • 7.0+ Maybe the Holy Grail!

Tradervue will now calculate the SQN for any set of trades – it is shown in the stats tables on the Detailed, Win vs. Loss Days, and Compare tabs. Note that since the SQN is calculated using risk-based results, it will only be shown when running Tradervue reports in R mode.

The SQN calculation is available now for all users with a Gold subscription plan.

New statistics available

On the statistics tables (in the Reports View, on the Detailed, Win vs Loss Days, and Compare tabs), we have added four new statistics:

  • Average trade gain/loss
  • Average winning trade
  • Average losing trade
  • Trade P&L standard deviation

The first three are self-explanatory; these were actually available before in the Win/Loss/Expectation sub-group, but they are important enough that we have moved them up into the statistics tables.

The standard deviation is new. It’s not complex – we’re just taking the standard deviation of the P&L for all trades matching the current filter – but it can show some interesting things about your trading. For example, suppose we have:

stdev1

Here, our average trade P&L is $4.10, but our standard deviation is a whopping $27.81 – almost 7 times the average. This suggests that our performance with these trades might well be little more than luck.

Now let us consider:

stdev2

In this case, the average is much higher in relation to the standard deviation, and thus our performance on this set of trades is likely more statistically significant.

These stats can of course be used with other reporting features. A couple of examples to get started with:

  • Show standard deviation in R instead of $ using the new risk reports
  • Compare these stats for two different trading systems using the Compare reports

These new statistics are available today for all users!

MFE and MAE calculations

Tradervue now calculates MFE and MAE statistics for your trades! This has been a very popular request, and we’re happy to have it in for you now.

When you view a trade, below the list of executions you will see the “Show trade stats” link:

Clicking that link to show stats will show the MFE/MAE data for the trade:

Tradervue reports four different stats here:

Position MFE – the maximum interim profit during the trade. Usually referred to as Maximum Favorable Excursion, and sometimes referred to as runup.

Position MAE – the maximum interim loss during the trade. Usually referred to as Maximum Adverse Excursion, and sometimes referred to as drawdown.

Price MFE – the maximum favorable price movement during the trade, independent of position size.

Price MAE – the maximum adverse price movement, independent of position size.

We have also added two related reports – Distribution and Performance by in-trade price range:

This shows your trading performance (or frequency) by how much of a price swing the trade experienced while you were in the trade.

Average position MFE/MAE is also available on the Detailed report stats, and also on the win vs. loss and compare report tabs.

These new statistics and reports are available now for all silver and gold subscribers!

Profit Factor added to stats

The statistics at the top of the Detailed reports tab now includes Profit Factor. It is also on the Win/Loss Days tab and the Compare tab, for each trade group.

In gross reporting mode, the profit factor is calculated as

    profit factor = gross profits / gross losses

In net reporting mode (for gold subscribers), the profit factor is

    profit factor = net profits / net losses

Where net profits and losses are the gross profits/losses, less commissions and fees.

Consecutive wins/losses

The statistics table at the top of the detailed reports page now shows the maximum number of consecutive wins and losses:

Each side has a “show” link – if you click on that link, you will see the particular sequence of trades that’s making up the consecutive win/loss streak. In addition, when you do this the global filter is modified to just show those trades; that means you can browse through the rest of the reports, and see data for only the particular sequence of trades.

So for example, say you had a losing streak of 20 trades. If you click on the “show” link, you’ll see just those 20 trades. Then go back to the detailed reports page, and go to (say) the liquidity group – you might find your losing trades all have something in common that you didn’t expect.

Note that this, just like all other data in the statistics table, is reporting on the trades that are selected via the global filter bar. If you filter on just SPY trades, for example, the consecutive wins/losses will be just for the SPY trades.

The max consecutive wins and losses is available for all users – go take a look!