
We have added new reports showing distribution and performance based on your entry price in relation to various moving averages for the instrument you’re trading. These can be surprisingly useful in identifying previously unknown patterns in your performance.
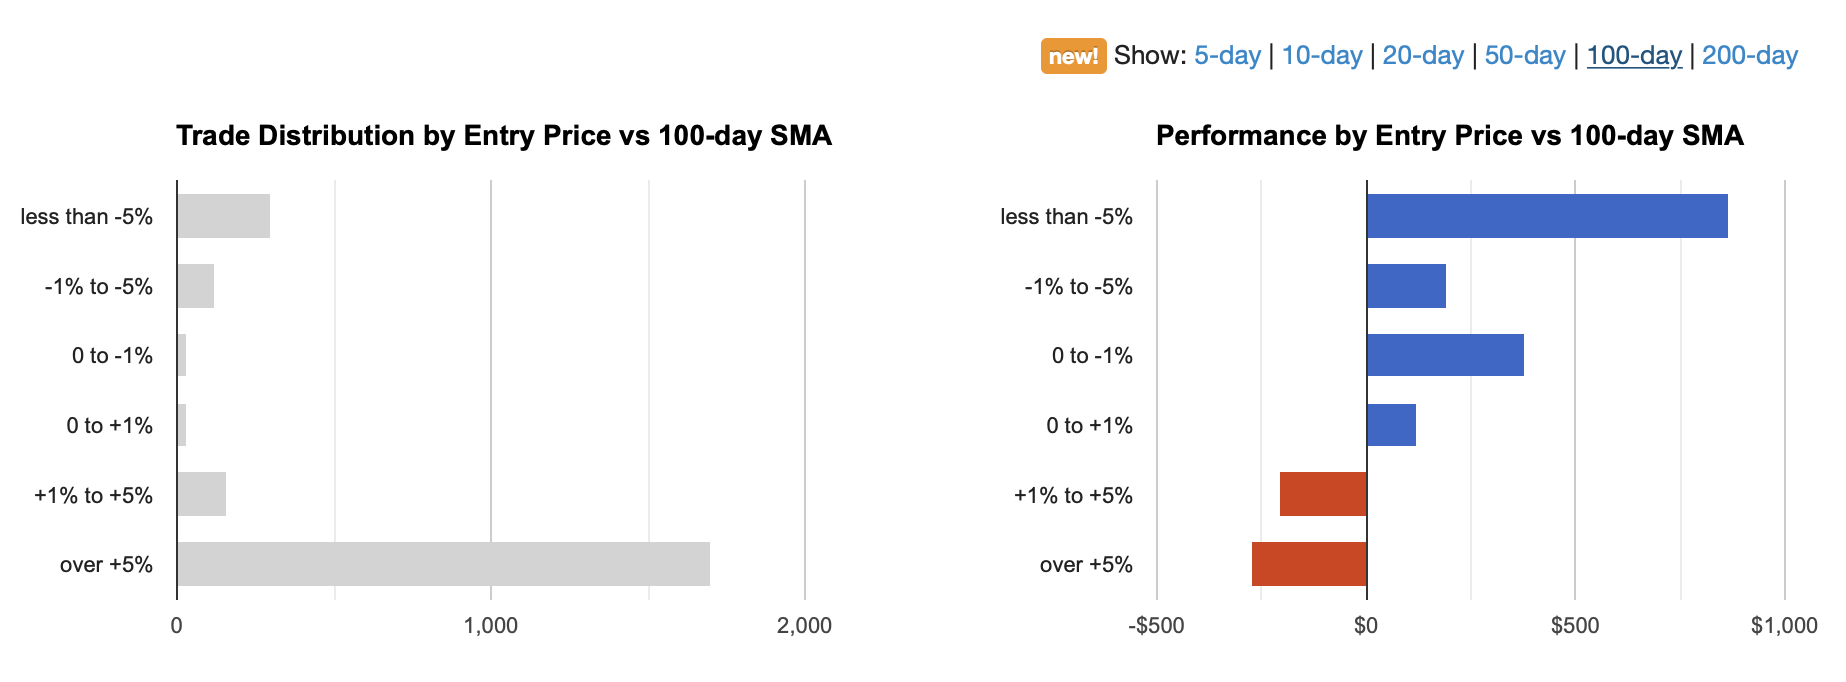
In the chart above, the “less than -5%” bar, for example, shows performance for trades that were entered at a price that was more than 5% below the 100-day SMA for that instrument.
These reports are available in Reports View, Detailed tab, Instrument group. They are also shown in the Win vs Loss Days and Compare tabs, in the instrument group.
5-, 10-, 20-, 50-, 100-, and 200-day simple moving averages are available. And as with most reports, these are interactive and support filtering on the data by clicking on the bars in the reports.
So as an example, let’s look at the 10-day SMA chart for a particular set of trades:
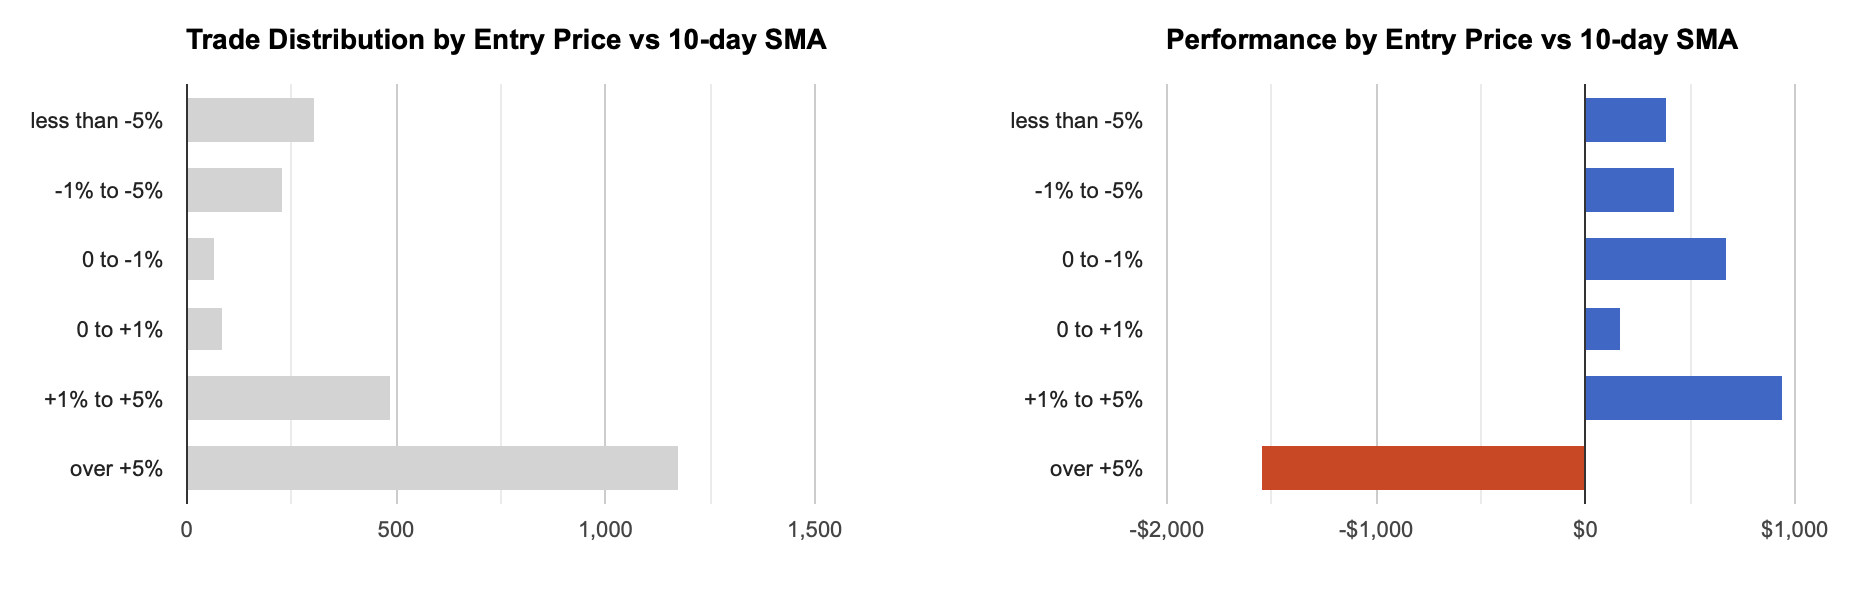
We’re seeing poor performance when entering a trade where we’re significantly extended above the SMA(10). If we filter to show only trades at or below +5% above the SMA(10), we now see:
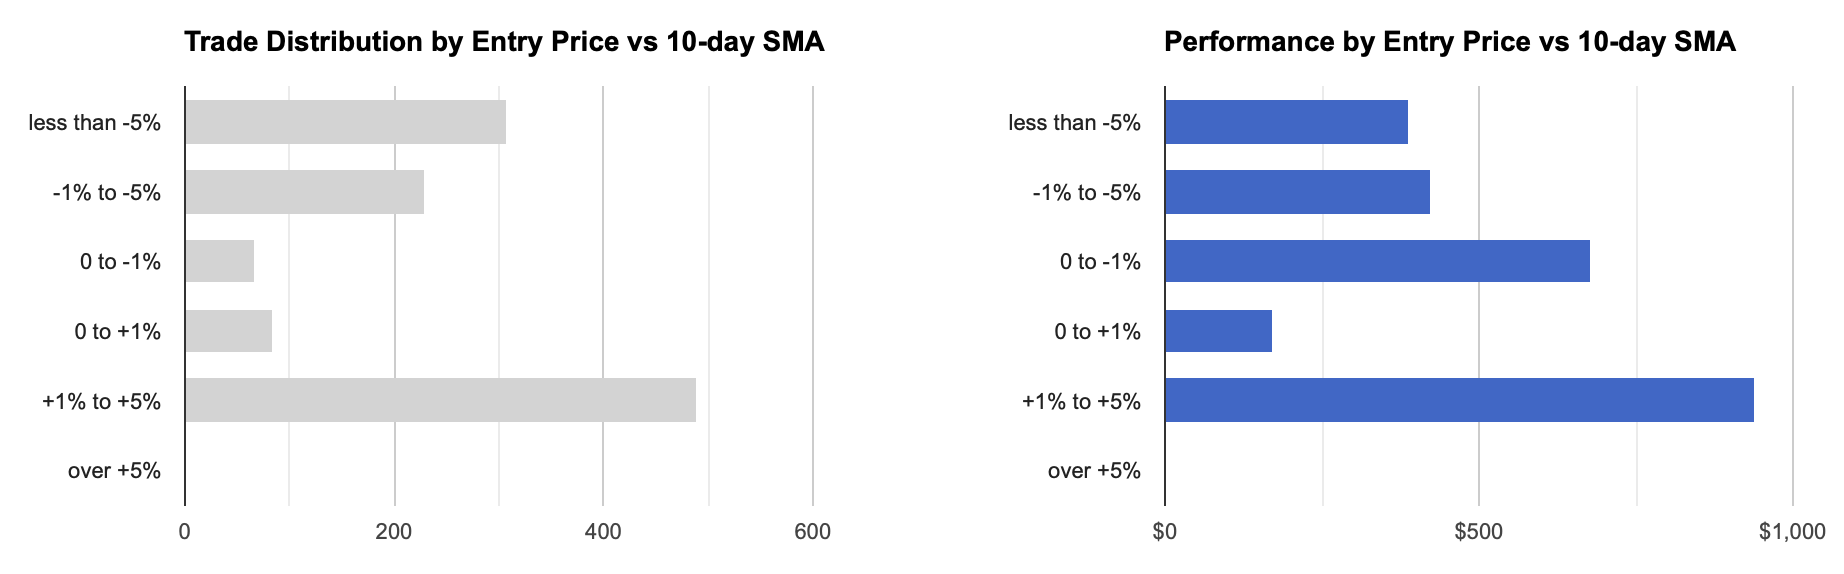
With that filter enabled, if we now switch to the SMA(5) chart, we can see that we could potentially further refine our system by eliminating trades more than 1% above the SMA(5):
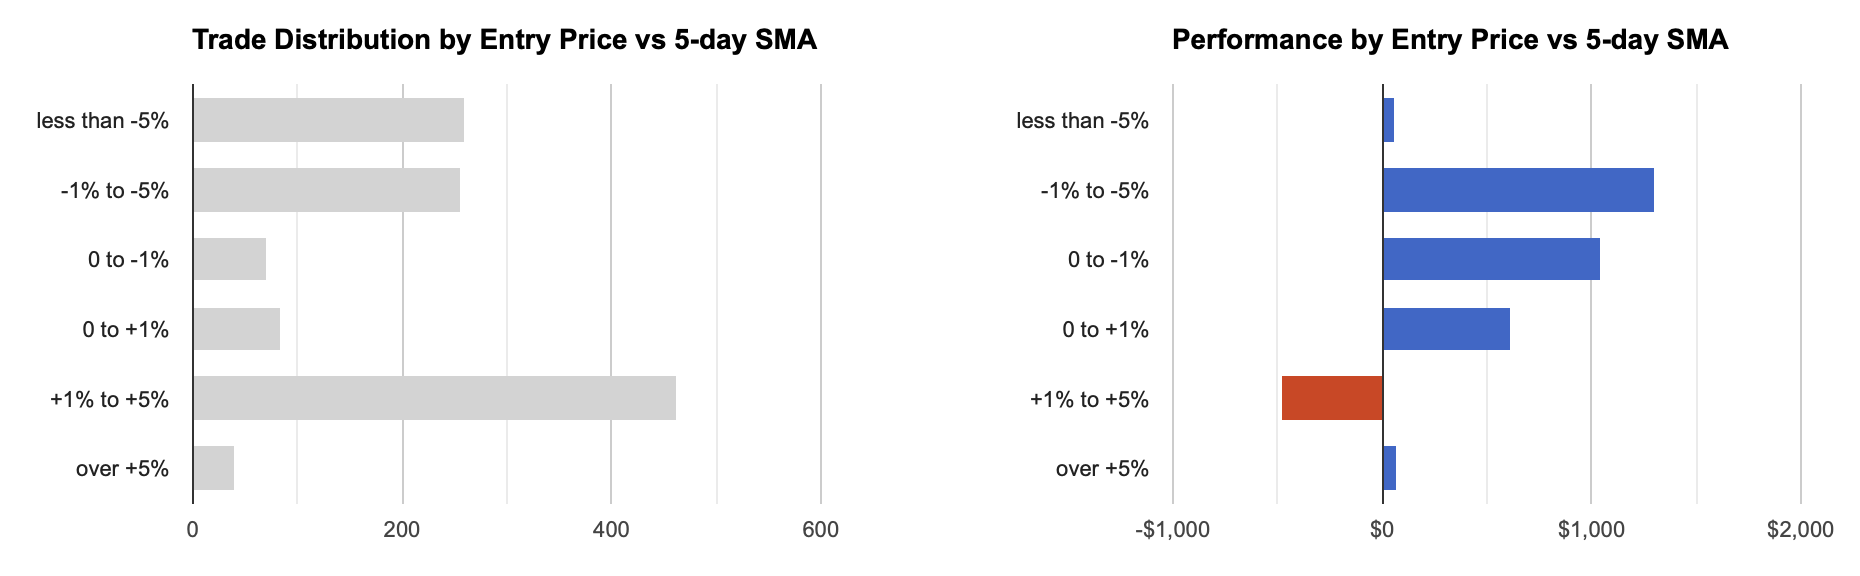
This can be especially valuable when, for example, the SMA’s are not part of your entry criteria for a trade, but the data reveals that they can help refine your system to improve the probability of winning.
SMA reports are available now for all users. Users on the free plan have access to the 50-day SMA only; silver and gold users have access to all of the supported SMAs.