Tradervue now calculates MFE and MAE statistics for your trades! This has been a very popular request, and we’re happy to have it in for you now.
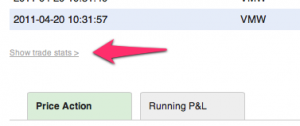
When you view a trade, below the list of executions you will see the “Show trade stats” link:
Clicking that link to show stats will show the MFE/MAE data for the trade:
Tradervue reports four different stats here:
Position MFE – the maximum interim profit during the trade. Usually referred to as Maximum Favorable Excursion, and sometimes referred to as runup.
Position MAE – the maximum interim loss during the trade. Usually referred to as Maximum Adverse Excursion, and sometimes referred to as drawdown.
Price MFE – the maximum favorable price movement during the trade, independent of position size.
Price MAE – the maximum adverse price movement, independent of position size.
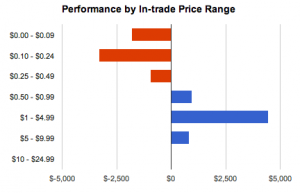
We have also added two related reports – Distribution and Performance by in-trade price range:
This shows your trading performance (or frequency) by how much of a price swing the trade experienced while you were in the trade.
Average position MFE/MAE is also available on the Detailed report stats, and also on the win vs. loss and compare report tabs.
These new statistics and reports are available now for all silver and gold subscribers!


