New Recent reports

On the Overview tab of the Reports section of Tradervue, we’ve added a “Recent” report group. The Recent reports will show you a quick snapshot of your trading performance over the last 30 trading days.

recent1

There are four charts in this group, all of which cover the last 30 trading days:

  • Daily P&L (or average per-trade P&L, depending on the setting)
  • Cumulative P&L
  • Daily volume
  • Win %

These new reports are available immediately for all Tradervue users!

Overview reports enhancements

Up to now, the Overview reports offered an aggregate P&L for a particular year or month. Now, similar to the other reports, we’ve added a report type setting to switch them to a per-trade average:

You can now review the months of a year and compare your average per-trade P&L, in addition to the total P&L for the month.

Here’s the aggregate version:

And the per-trade average version:

Overview reports are available for all users!

Reporting by Month

We’ve all heard “sell in May and go away”…but how much truth is in that? Well, now you can see for yourself, with your own data.

Now on the Detailed reports tab, Days/Times group, you will see the Distribution/Performance by Month of Year report…see your historically best and worst months, and plan your vacation! 🙂

There are also reports by month on the Overview reports tab – the difference is that on the Overview report, the months are shown for a specific year. On the Detailed tab, the “Jan” month includes trades from every January.

These new reports are available now for all users.

Simple stop analysis

A couple of weeks ago, I was having a conversation over email with someone who was trying different stops and wanted to evaluate their effect on his performance. After thinking about this a bit, I wanted to mention a quick and dirty way to see whether using wider stops is effective for you.

To create the following chart in Tradervue, I went to Reports, clicked the Advanced tab, and selected:

  • X-axis: Trade open date/time
  • Y-axis: Position MAE
  • Scale data points by trade P&L – checked

On the horizontal axis we’re plotting the trades against time; this doesn’t matter too much in this case, I just wanted to make sure we spread them out over the chart. On the vertical axis, we’re plotting the position MAE. This is the maximum interim loss we experienced in each trade. And finally, the size of each point represents the P&L of the trade. Green is a win, red is a loss, and the relative size of the point represents the magnitude…so big and red is bad, and big/green is good.

During this period, I was typically using stops on my positions that represented a total of $40 of risk. I was, however, experimenting with using larger stops for some trades.

So how did it go? Well, if we look at the -$40 line, all of the trades below that line were trades that had wider stops, and thus moved against me more than $40 at some point during the trade. I know this with certainty since, if they had stops of $40 or less, they would not have moved against me more than $40.

Looking at the trades below the -$40 line, I see that there were a couple of wins (these would be trades that moved against me more than $40 during the trade, but turned around and became winners), but many more losses.

So in this case, we can see at a glance that in these particular circumstances, widening my stops to more than $40/trade was not effective. Not at all!

This is, of course, a very simplified way to look at your stops, and there are many more factors you may want to consider…but this gives you a quick view of what actually happened, and may allow you to make some decisions more quickly.

[Advanced reports used for this post are available for all silver and gold subscribers.]

New reports based on trading instrument behavior

Wow…it’s been a great couple of weeks for analysis and reporting in Tradervue. On the heels of the new MFE/MAE calculations from last week, we’ve now added 8 new reports (16 if you also count the distribution charts) for analyzing performance based on what your stock or future was doing.

These are useful for everyone, but especially useful for equity traders, who may be trading a number of instruments based on news or order flow.

On the detailed reports tab (and also on the win vs. loss days and compare tabs), there is a new reports group called “Instrument”:

Click on that, and you’ll see the old performance by symbol reports at the top (these were previously in the Instrument/Price/Volume group), but then a bunch of new reports!

First, three reports based on instrument volume:

Distribution/Performance by Instrument volume – shows your performance plotted against the total volume traded on the day

Distribution/Performance by Instrument relative volume – shows your performance plotted against the relative volume traded on the day. Specifically, this is the volume with respect to the 50-day moving average of volume. Helps you understand your performance on days with unusually high volume, for example.

Distribution/Performance by Instrument Prior day relative volume – shows your performance plotted against the relative volume traded on the day before the trade. Specifically, this is the volume with respect to the 50-day moving average of volume. Helps you understand your performance on follow-through days, for example.

Then three reports based on the movement of the stock on the day you traded it:

Distribution/Performance by Instrument movement – shows your performance against the total move of the instrument on the day.

Distribution/Performance by Instrument opening gap – shows your performance against the opening gap of the instrument on the day. If you’re typically trading on news, and watching for large opening gaps, this can give you some insight into whether that’s working for you.

Distribution/Performance by Instrument day type – shows your performance plotted against the day type of the particular instrument you’re trading. Are you successfully capturing the move on days when your particular stock is trending? This will help you understand that.

And finally, two reports based on the Average True Range (ATR) of the instruments traded:

Distribution/Performance by Instrument ATR – shows your performance against the ATR(14) of the instruments traded.

Distribution/Performance by Entry % of ATR – shows your performance against how much of the ATR was already “used” on the day. For example, if you’re entering trades after they’ve already moved 2x their ATR, this will show you details about that.

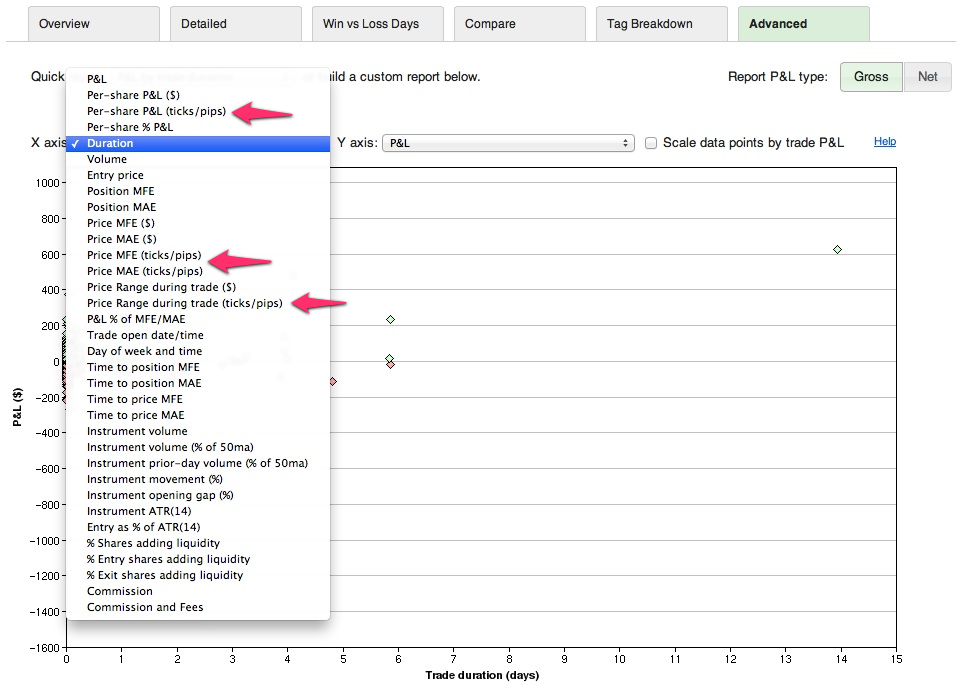
In addition to all of that, the following statistics are now available in the Advanced reports for plotting on either axis:

  • Instrument volume
  • Instrument volume (% of 50ma)
  • Instrument prior-day volume (% of 50ma)
  • Instrument movement (%)
  • Instrument opening gap (%)
  • Instrument ATR(14)
  • Entry as % of ATR(14)

Whew! That’s a big update. The distribution/performance by instrument volume reports are available for all users, and the other new reports are available to all users with a silver or gold subscription. Give them a try today!

MFE and MAE calculations

Tradervue now calculates MFE and MAE statistics for your trades! This has been a very popular request, and we’re happy to have it in for you now.

When you view a trade, below the list of executions you will see the “Show trade stats” link:

Clicking that link to show stats will show the MFE/MAE data for the trade:

Tradervue reports four different stats here:

Position MFE – the maximum interim profit during the trade. Usually referred to as Maximum Favorable Excursion, and sometimes referred to as runup.

Position MAE – the maximum interim loss during the trade. Usually referred to as Maximum Adverse Excursion, and sometimes referred to as drawdown.

Price MFE – the maximum favorable price movement during the trade, independent of position size.

Price MAE – the maximum adverse price movement, independent of position size.

We have also added two related reports – Distribution and Performance by in-trade price range:

This shows your trading performance (or frequency) by how much of a price swing the trade experienced while you were in the trade.

Average position MFE/MAE is also available on the Detailed report stats, and also on the win vs. loss and compare report tabs.

These new statistics and reports are available now for all silver and gold subscribers!

New tag combination report

Back in April, we released the Tag Breakdown report, which allows you to see your performance broken out by tag. For those using tags (and you should be!), this is tremendously useful:

You can also filter by tags, including multiple tags at a time, to help narrow down the trades you’re reviewing or analyzing.

But what if you use tags for, say, trade entry criteria, and you use multiple tags for different criteria? For example, perhaps you have some trades tagged with the following:

trade 1: support, ema9
trade 2: support, ema20
trade 3: resistance, momentum
trade 4: resistance, breakout
trade 5: support, ema20

You can quickly build filters to narrow down your data, but what if you wanted to see which unique combinations of entry criteria were most effective? To address this, we have added a new way to look at your tags, by clicking on the “Tag Combinations” button on the reports Tag Breakdown tab. This shows you the unique combinations of tags you have used:

You can combine this Tag Combination report with tag (and other) filters, as you would expect.

This new tag combination report is available now for all Silver and Gold users. If you haven’t tried all of the reporting and analysis capabilities of the silver or gold plans, you can try them out with a free 7-day trial!

(Free trial available to users who have not been on a premium plan in the past; if you’re eligible, you will see a note to that effect on the Plans & Billing tab when you go to upgrade.)

New drawdown report

We’ve added a new drawdown report, showing your cumulative drawdown for the report period:

You can find this new report on the Detailed reports tab, Win/Loss/Expectation group (quick link). You can also find it on the Compare reports tab, also in the Win/Loss/Expectation group.

New symbol filters

You’ve always been able to filter trades in Tradervue by symbol, among other things. But many futures traders trade multiple contracts, on multiple underlying assets, and need a way to group these together for reporting.

For example, if I have traded ESZ1, ESU2, ESZ2, CLU2, and CLV2, I can filter on any of these specific contracts. But what if I want to see consolidated results for just the three ES contracts? Up to now, tags would be the only solution.

Starting today, you can use wildcards in the symbol filter, in the global filter bar. Specifically:

  • Use * to match any number of characters
  • Use ? to match any one character

So a few examples:

  • ES* would match all ES contracts
  • ES?2 would match all 2012 ES contracts
  • ESZ* would match December ES contracts in all years

Just one more way to slice up your data, and really understand your trading.