
You can now import your trading data from Nonko Trading. As always, click on Import Trades, select Nonko from the list, and follow the instructions on the right side of the page!
Monthly Archives: March 2015
Exit Analysis
There has been much written (with more every day!) about where to enter a trade. But often, exiting a trade is even more important in terms of impact to your P&L – and for many traders, much more difficult. So we have added some calculations to help analyze your trade exits – helping you answer the questions like did you exit at the right place, and how much did you leave on the table?
Before we get too far into this, let me mention that for some trades, this is irrelevant. If you enter a momentum trade, it ticks up a few points, and you sell when the momentum dries up, you made the right decision according to your plan. If the stock consolidates for an hour, then pops up another 6 points, it doesn’t matter – you still made the right decision. On the other hand, if your plan was to make a trend trade, then perhaps you should have captured more of the move.
Starting today, Tradervue will calculate the “best exit” P&L for each of your eligible trades. That best exit is determined by “floating” the last exit executions up to their highest point (or lowest, in the case of a short); this exit point may be before or after your actual exit. By looking at this best exit value in comparison to your actual P&L in the trade, you can quickly see how efficient you were in terms of extracting P&L.
Let’s consider a simple trade in FDX. We bought, we sold a bit, then we bought some more, and then exited:
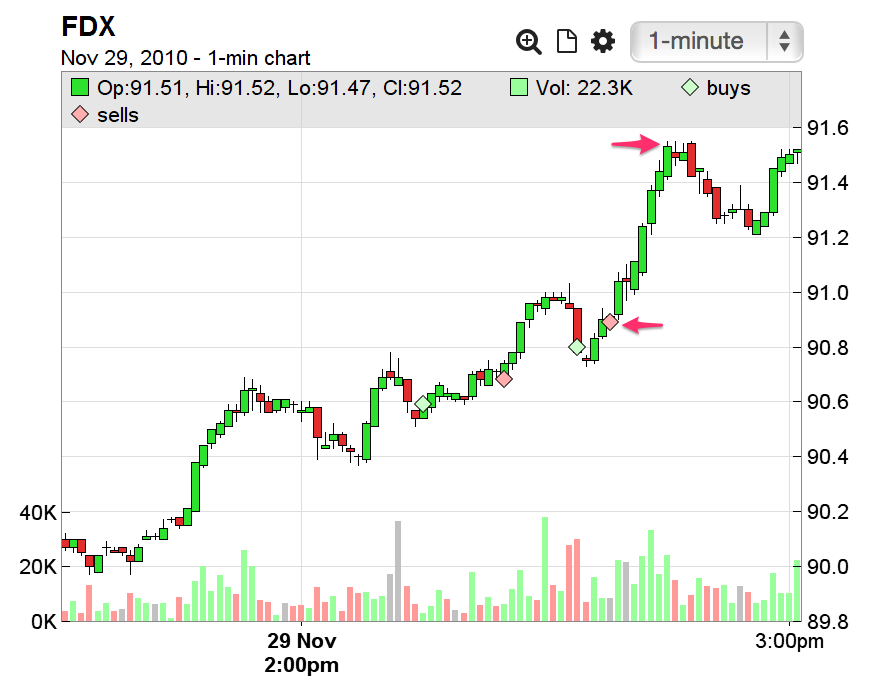 Looking at that last exit, we see that if we had delayed it a few minutes, we could have extracted much more from this trade.
Sometimes you might scale out of a trade in pieces. Perhaps you sell part to cover risk, sell part into an anticipated resistance level, and then sell the last part on a discretionary basis. Tradervue will assume all exits prior to the last one are done according to your trading plan, and won’t question them – but it will make calculations based on the last one. So for example:
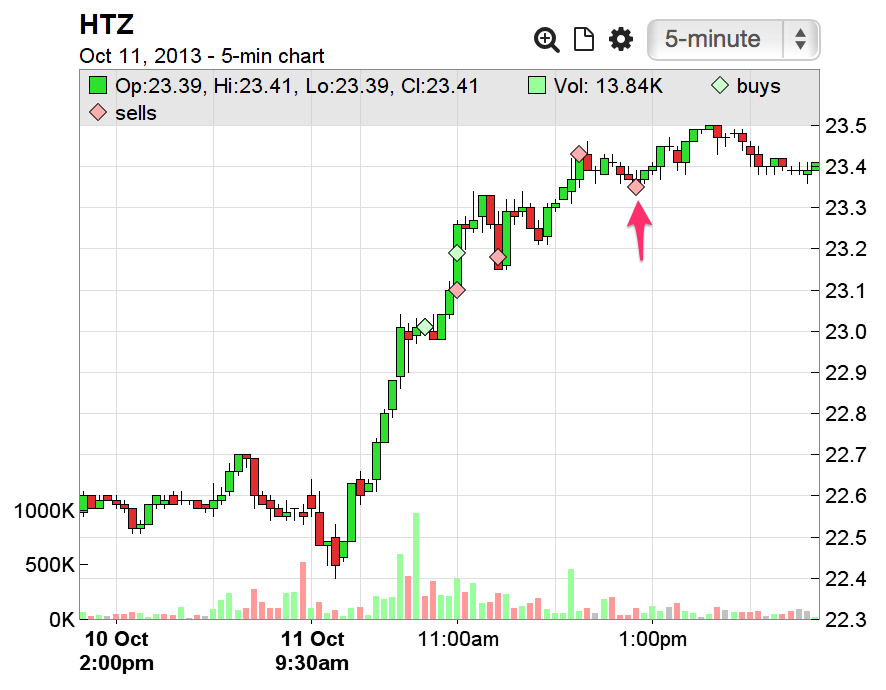
For this trade, only the last execution will be moved around to find the best exit P&L.
Of course, none of this matters if you would have to suffer a large drawdown to get to your theoretical maximum P&L. For this reason, Tradervue takes risk into account when calculating your best exit P&L. Specifically, it looks at:
- How much drawdown did you take on in the real trade (i.e. the Position MAE of the trade). We’re not going to assume you’re willing to take on more risk than this.
- What was your specified Initial Risk value for the trade? (if you’re using Tradervue’s risk management features)
The larger of those two values will be used as the max drawdown value when calculating where the best exit would be.
As an example:
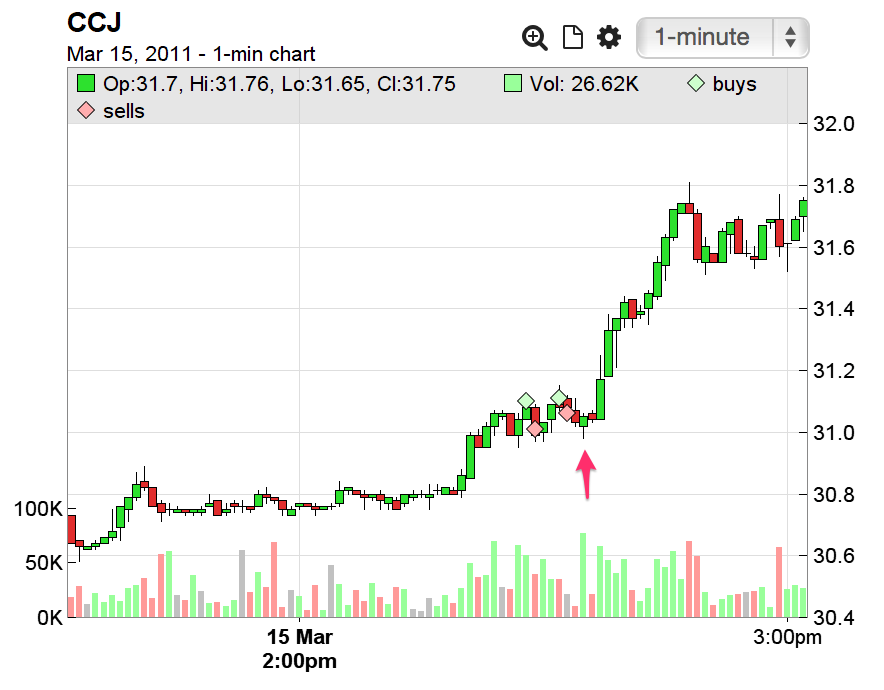
We see that the last sale could have been much better – about 0.75 higher. However, immediately after that last sale, we see the price dropped further. We were already at a loss at this point, and if we held that last part of the position, we’d be at an even greater loss than you took in the actual trade – which, unless a larger initial risk was specified, is not acceptable. Therefore, the best exit for that execution would be the top of the exit bar, only about 0.06 higher than the actual exit.
However, suppose the plotted executions were 100 shares each, and we specified an initial risk value of $50. In that case, the drawdown after the last exit would not exceed the allowable risk, and it would be moved to the peak at about 31.80 for purposes of best exit calculations.
Tradervue will calculate two values for each trade:
- the best exit P&L
- the exit efficiency (in %)
The exit efficiency is only calculated for trades that you closed as winners, and is calculated as
(actual P&L) / (best exit P&L)
Basically, it represents what % of the theoretical P&L did you extract from the trade.
This data can be quite surprising; look at this short V trade:
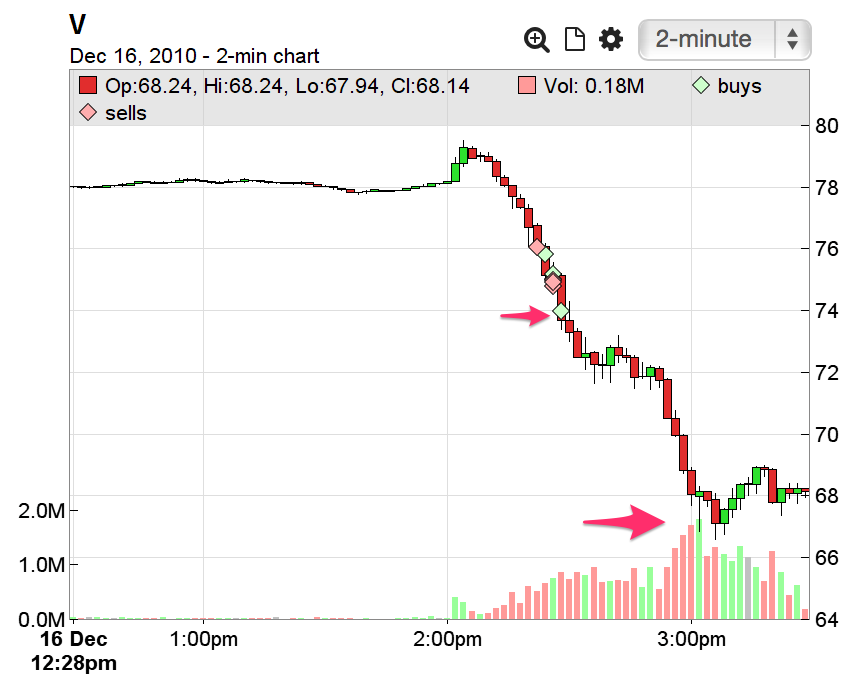 We see there were some entries and exits working into this trade, and then the final cover at about 74. But we can also see that without accepting any additional risk, the best exit would have been at about 67. For this trade, that makes our exit efficiency at about 9.2% – clearly a trade we can learn a lot from, and study further to help us understand why we exited so early.
The new calculations appear in several places:
- It’s in the trade statistics for each trade:
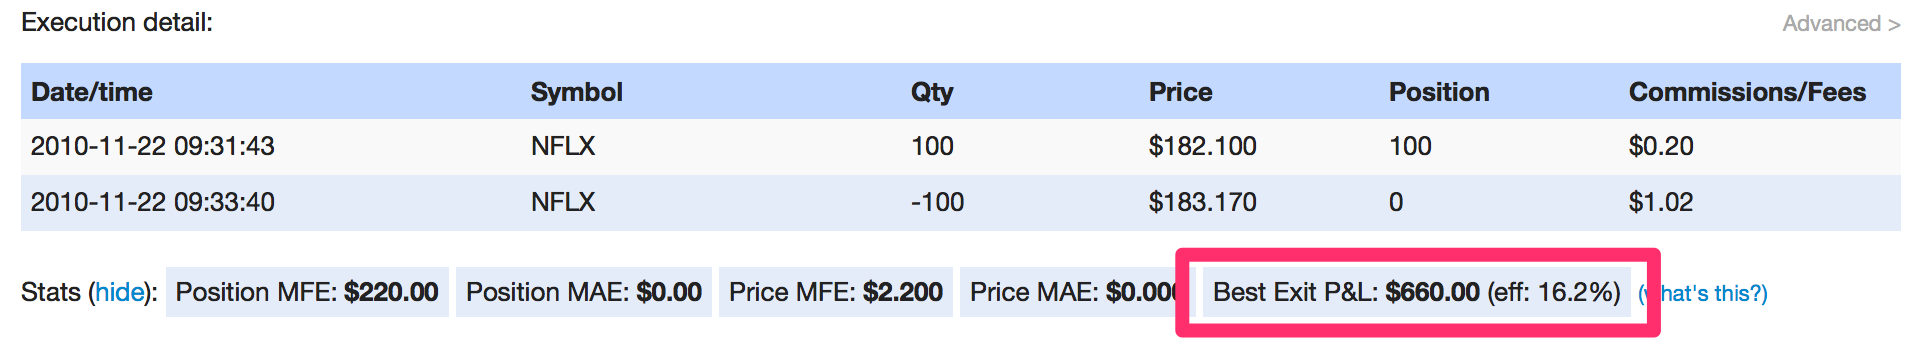 If you hover over the words “Best Exit P&L”, the time of the best exit will be shown.
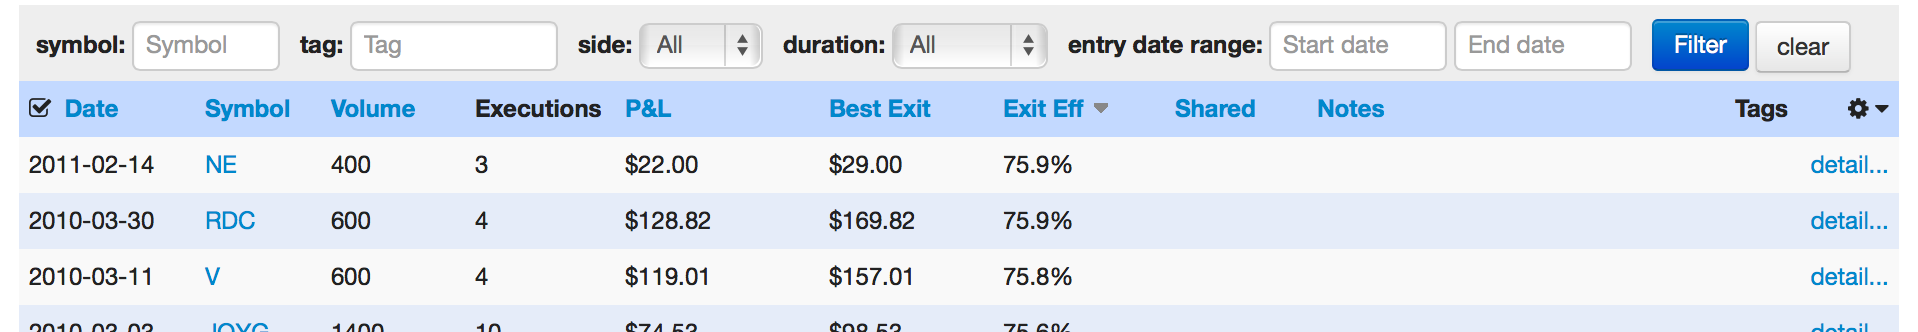
 - There are new Best Exit and Exit Efficiency columns available in the Trades View:
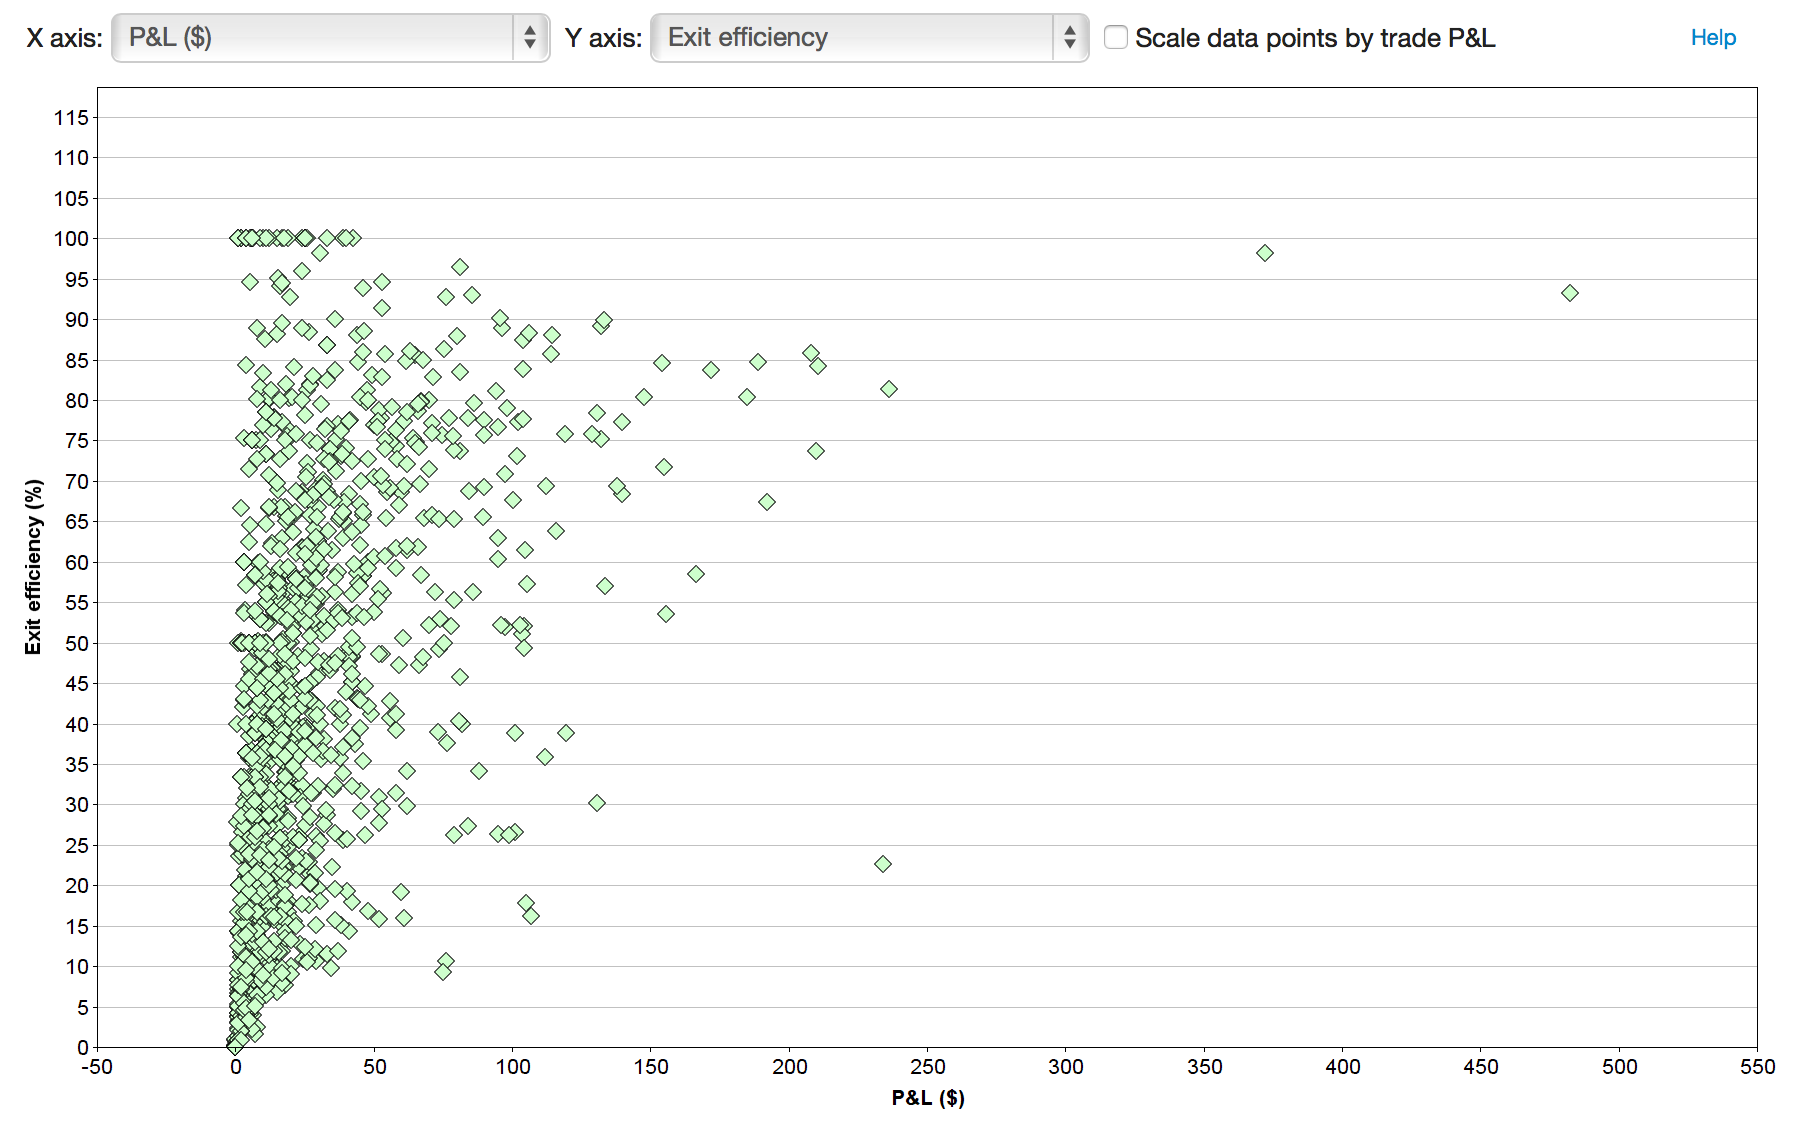
- Selectable data points in the advanced reports:
Exit analysis is automatically done for all closed stock, futures, and forex trades, under 7 days in duration, done during regular market hours (for stocks). The time period considered runs out until the end of the trading day for each trade (which may be the next calendar day for futures).
There are some further specifics available on the Exit Analysis help page.
Exit analysis is available today for all users on the gold subscription plan!
UPDATE 04/13/2015: Exit analysis is now enabled for forex trades.
New relative volatility report
A while back, we added reports into Tradervue that would show how trading performance related to the behavior of the underlying instrument, including its Average True Range (ATR). Today, we’ve added a new report related to these.
ATR represents the recent volatility in a trading instrument, in terms of the average daily range of movement in the instrument. The new report shows the True Range of the instrument on the trading day, divided by the ATR(14), expressed as a percentage:
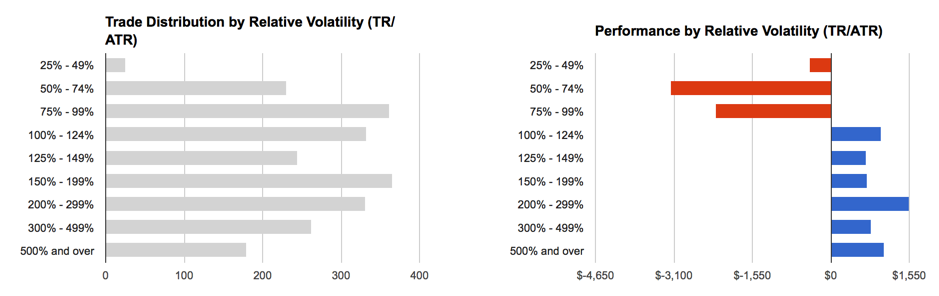
This TR/ATR is a measure of relative volatility of an instrument; namely, did it move more or less today relative to its recent 14-day average range. The higher the percentage, the more the instruments true range on the day exceeded the ATR, and was thus more volatile than expected.
In the example above, we can see the trader’s P&L performance was dramatically better on days when the instrument he was trading was moving more than its ATR, and underperformed when the instrument was moving less.
The new reports are available immediately for all silver and gold users on the Reports View, Detailed tab, Instrument group. They are also available on the Win vs Loss Days and Compare tabs.