Using Tradervue for analysis

Grove Under has been using Tradervue for quite some time, and last week he wrote a post called Using Tradervue for analysis of autotrading The Lincoln Million. Basically he has been autotrading a system for the last couple of months, and he goes into some analysis of it using Tradervue.

One of his charts shows an analysis of the stops he used:

TLM review 4 4-12-2013

This chart yields quite a bit of insight into how the system has been working, and possible ways to improve it…and he’s got a lot more where this came from. I encourage you to go read the entire post – there are some great nuggets of analysis wisdom in it!

New tick reporting

For futures traders, we have added the ability for all of the reports to display P&L data in ticks rather than $ (or R). When you visit the reports, you will now see an additional available mode, depending on your subscription.

Silver users will see the new tick mode:

reptick2

And gold users will see the tick mode, in addition to their gross/net and R options:

reptick1

Clicking the “T” will switch all P&L values in the reports to be in ticks, rather than $.

A couple of important notes about this:

  • Only futures trades will be shown in tick mode. Other trades will not appear in the reports when in this mode.
  • While each trade may have a different tick size (e.g. ES vs CL trades), the reporting normalizes them to just “ticks”. So if you made 2 ticks in an ES trade, and 5 ticks in a CL trade, the combined P&L for the two trades will be displayed as 7 ticks.

Tick reporting is available today for all futures trades!

Recent P&L chart now interactive

The new Recent report group on the Overview reports has been very popular since its introduction a couple of months ago.

Today, we have improved them by making the 30-day P&L chart interactive. You can now click on a bar for a specific day, and automatically filter your trades down to just that day so you can quickly investigate them in more detail:

recent_interactive

While most of the interactive reports in Tradervue require a silver or gold subscription, this one is enabled for all users!

Initial Risk added to manual trades

Many of you are using the Tradervue workflow where you create new manual trades (e.g. click “New Trade”) during the day to make notes, and then import your execution data later to match up with those trades.

If you’re doing this, it’s at the point when you’re entering the trade – and creating the new trade in Tradervue – that you know your initial risk in the trade (see our earlier post on risk tracking and reporting for details about this). Therefore, we have added an Initial Risk entry when creating a new trade:

newtrade_risk2

If you have a default per-trade risk defined (in your Trade Settings), that value will be pre-populated for you.

This should streamline the workflow for users manually creating trades during the day who are also using the risk management functionality of the Gold plan!

Shared trade changes

Sharing trades on Tradervue has proven to be quite popular, and more and more traders are sharing some of their trades with the community. As a result of this growing interest, we have made some changes to the way the shared trades pages work.

shared1

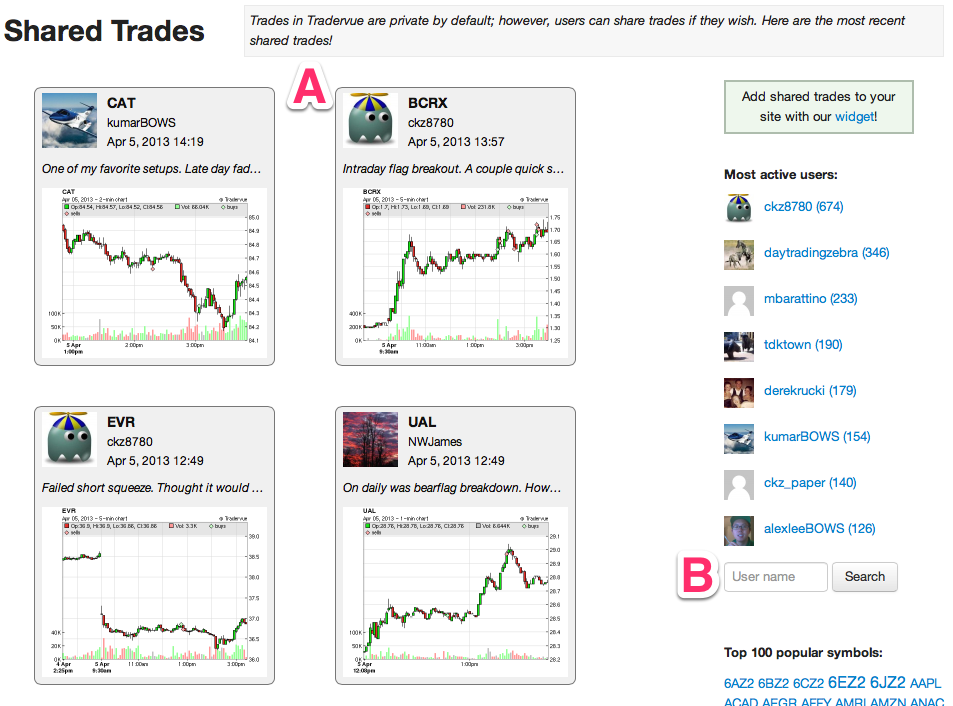
A – The shared trades pages will no longer show trades that have no notes. We have found that these trades rarely get comments, and are viewed far less than trades where the trader has made notes. So, from now on, trades that are shared with no notes will not show on the main Shared Trades pages, nor on the Tradervue front page. These trades with no notes will still show up on the trader’s personal shared trades page.

B – You can now search for a trader. If you know a trader’s username on Tradervue, enter it and click Search and you can go their personal shared trades page.

shared2

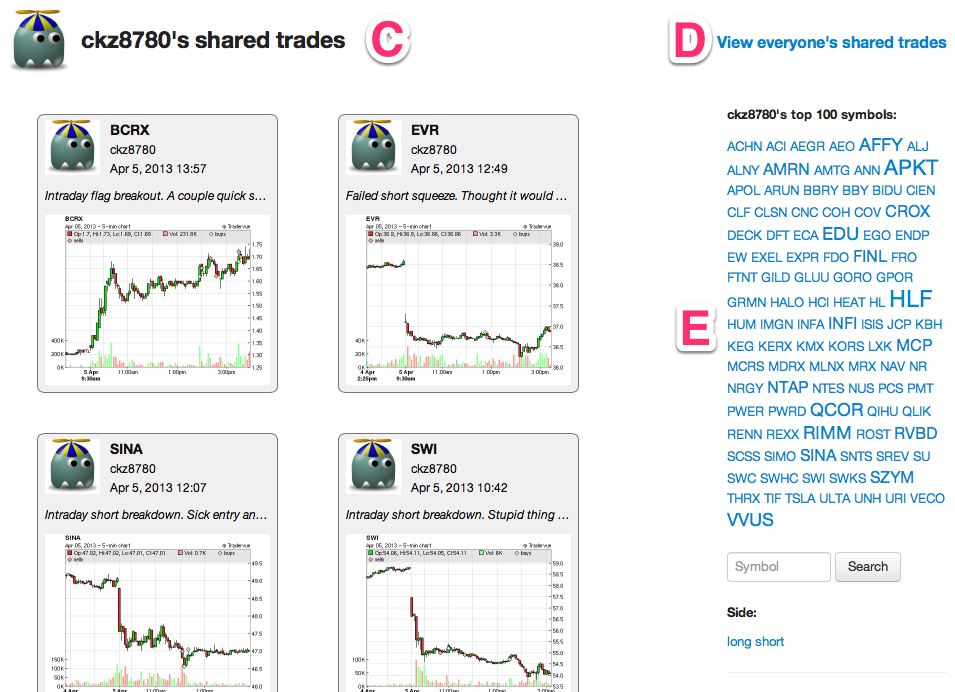
C – We have re-worked the page for viewing a particular user’s trades (example). On this personal page, the trader’s username and avatar are now shown in the upper left, so you know you’re viewing trades for just this user.

D – From a trader’s personal shared trades page, you can click “View everyone’s shared trades” to go back to the main Shared Trades page.

E – On the personal shared pages, we now show the top 100 symbols for that user, based on how many trades with those symbols are shared. If you click on one of those symbols, you will then see only trades from that user for that symbol.

All in all, we’ve made it much easier to find users on Tradervue, and to browse through their trades. If you have any suggestions, we’d love to hear them!

New statistics available

On the statistics tables (in the Reports View, on the Detailed, Win vs Loss Days, and Compare tabs), we have added four new statistics:

  • Average trade gain/loss
  • Average winning trade
  • Average losing trade
  • Trade P&L standard deviation

The first three are self-explanatory; these were actually available before in the Win/Loss/Expectation sub-group, but they are important enough that we have moved them up into the statistics tables.

The standard deviation is new. It’s not complex – we’re just taking the standard deviation of the P&L for all trades matching the current filter – but it can show some interesting things about your trading. For example, suppose we have:

stdev1

Here, our average trade P&L is $4.10, but our standard deviation is a whopping $27.81 – almost 7 times the average. This suggests that our performance with these trades might well be little more than luck.

Now let us consider:

stdev2

In this case, the average is much higher in relation to the standard deviation, and thus our performance on this set of trades is likely more statistically significant.

These stats can of course be used with other reporting features. A couple of examples to get started with:

  • Show standard deviation in R instead of $ using the new risk reports
  • Compare these stats for two different trading systems using the Compare reports

These new statistics are available today for all users!