Trend reports now available

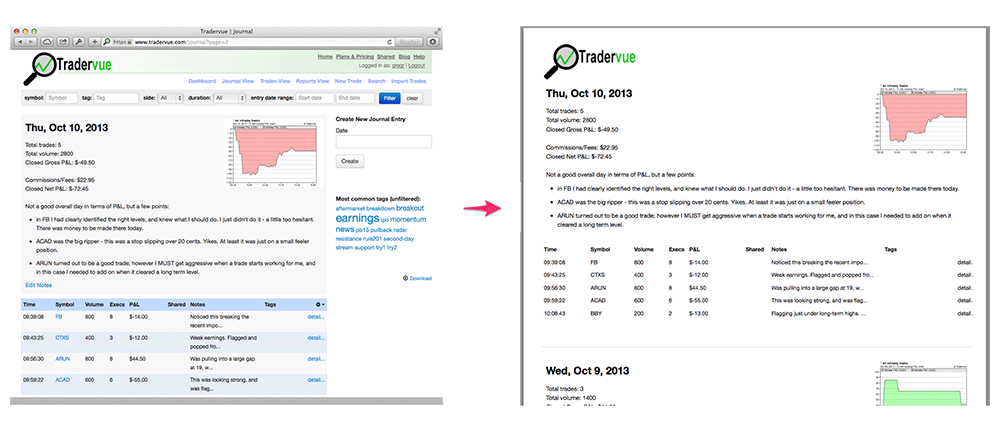
Often we want to analyze trading performance not just as a snapshot, but over time – to see if we are improving, see if a particular strategy is working better/worse, etc. And while we can look at a cumulative P&L to see part of this, that doesn’t always tell the whole story.

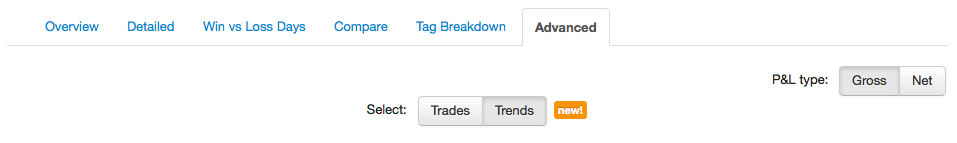
Tradervue has introduced new trend reports to help with this analysis. From the Reports View, click the Advanced tab, then go to the Trends group:

trend1

Once you do that, you’ll be able to look at running averages of your per-trade P&L and your win rate. So for example, here we are looking at a 50-day weighted moving average of win %:

trend2

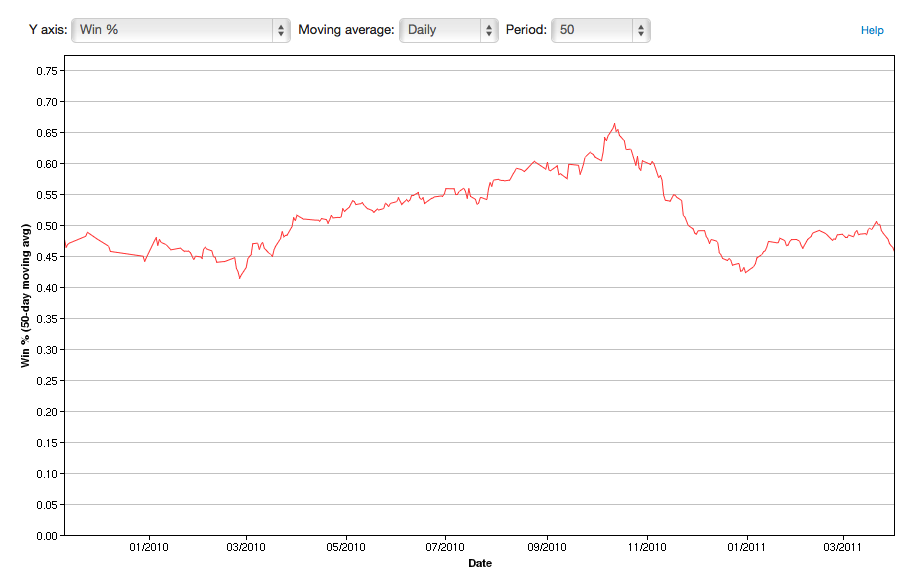
From looking at this chart, we can see a pronounced downturn around 10/2010, and we can use this information to help us drill down and understand what’s actually happening.

The trend reports can display P&L (in either $ or R), and win percentage, charted in one of two ways:

  • n trade moving average – this shows a moving average over the last n trades; the x axis will be the index into the list of trades being shown, sorted by open date/time.
  • n day moving average – this shows a weighted moving average of the per-trade P&L over the last n days. This is not an average of the daily P&L, but rather an average of the per-trade P&L.

As with all of the other reports in Tradervue, you can narrow the trade data used for the chart by using the trade filter. So, for example, you could look at the win percentage over time for one particular strategy (using tags), or just one particular symbol, or anything else you’d like to filter on.

For additional information on the trend reports, refer to their help page. And if there are other statistics you’d like to be able to view on these charts, let us know!

These new reports are available today for all silver and gold subscribers.

Price MFE/MAE columns

We’ve added two more columns to the list of available columns in the Trades View:

  • Price MFE – the maximum favorable price movement during the trade, independent of position size
  • Price MAE – the maximum adverse price movement during the trade, independent of position size

Let us know if there are other columns you’d like to see in the Trades View!

Print your journal and reports

It’s now possible to print your Journal or Reports – which has been a very popular request! To print, just visit the Journal View, or the Reports View, and use the normal print function in your browser. The format will change to be appropriate for printing:

print1

We recommend using Chrome, Firefox, or Safari for best results when printing.

Exporting reports data

A while back, we added the ability to download the data from the advanced reports. Now, we’ve expanded this with the ability to download daily transaction and P&L data from the Calendar reports.

At the bottom of the Calendar report, below the month calendars, you’ll see a new download link:

Tradervue___Reports

Set your settings the way you want them (Gross vs Net, $ vs Ticks vs R, aggregate vs average), and then click the Download link.  Your daily P&L data with the settings you chose will be downloaded to a CSV file, which you can open in Excel or elsewhere.

Report downloads and exports are available for all silver and gold subscribers.

Duration and side columns

With the new flexibility of being able to choose the columns you want to see in the Trades View, we’ve added even more. Two new columns available:

  • trade duration – this will look like 01:14:55 for intraday trades (that’s hours:minutes:seconds), or 4d for longer trades
  • side – this will be either Long or Short

If there are other columns you’d like to see in the Trades View, let us know!