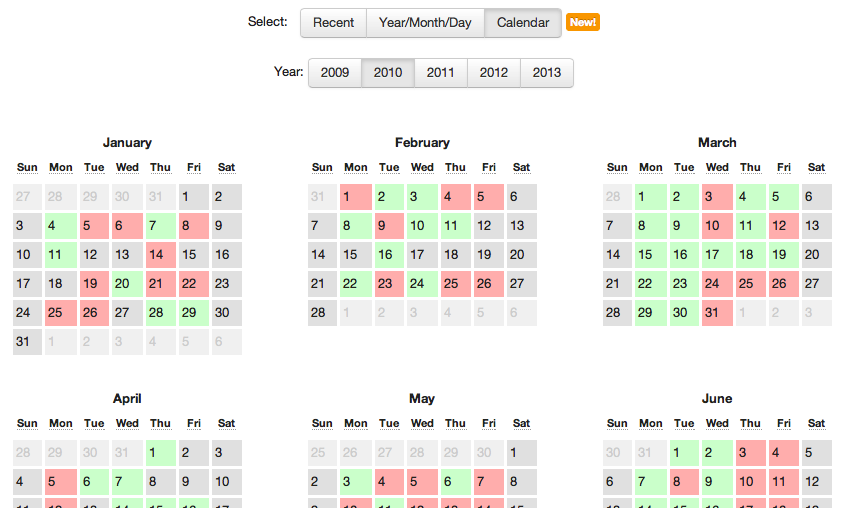
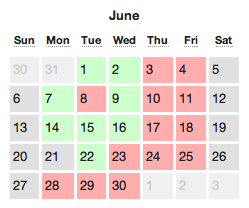
Today, we have overhauled the way Tradervue works for swing trades (or any multi-day trade). There are some small changes for intraday traders as well.
When Tradervue was first released back in 2011, its feature set focused on the needs of active intraday traders. Since then, we’ve enhanced these features dramatically…but over time, more and more traders were using it for overnight (or longer) trades. So now, we’ve gone through and made it work much better for these folks.
P&L Calculations
Tradervue now calculates realized P&L as of the date it occurs. Consider this trade:

The initial entry was on 9/10, along with a partial close later on 9/10, and scale-outs on 9/11 and 9/16. In the past, this trade would just be shown in Tradervue as “open”. Now, the trade details show the realized P&L:
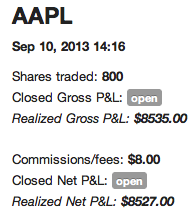
The trade is still shown as open, but the realized gross/net calculations are shown in italics. And on the Trades View, the realized data is also shown:

In the Trades View, the date in the left column is always the entry date of the trade. Additionally, when you use the filter to filter your trades, the start/end dates will filter on the entry date.
Realized P&L is calculated using a First-in, first-out (FIFO) methodology.
Journal View
In the past, trades were only shown in the Journal View on their entry date. Now, multi-day trades will be shown in the journal on every day there is activity. So here is an example of a day in the Journal View with several intraday trades, and a swing trade being opened:
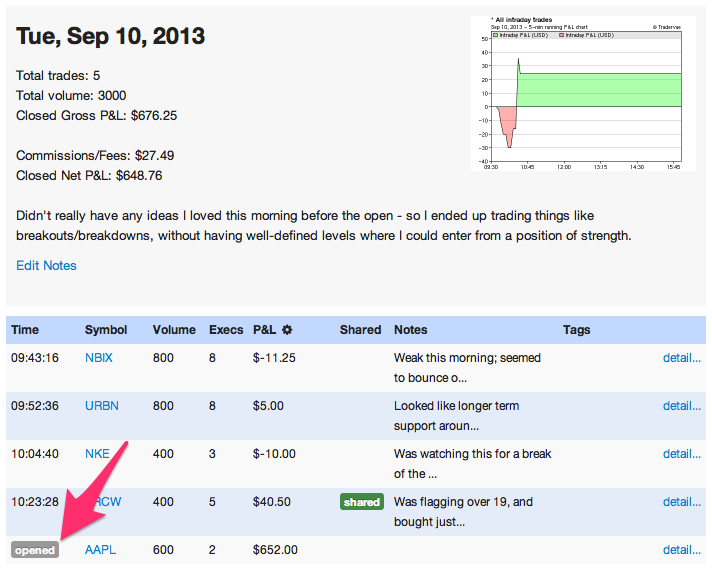
Note the label in the left column shows “opened”, which means this trade was opened on this day, and remained open. The P&L for that trade ($652.00) is the realized P&L for the trade on this day – if you refer to the trade detail above, you’ll see this is from the covering of the first 100 shares. The total P&L data for the day includes this value, since it has been realized.
Here’s how it looks for a day where an existing trade was adjusted:
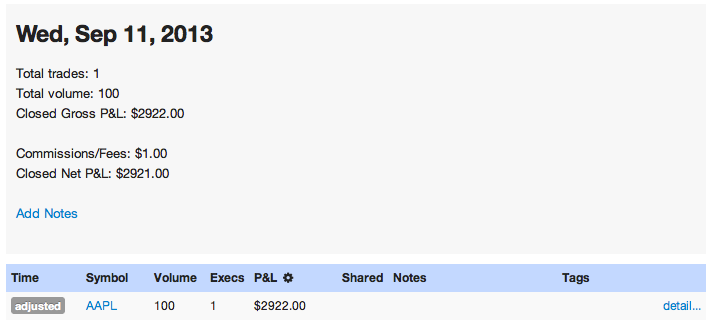
Here the left column says “adjusted”. The P&L shown for that trade, and for the day as a whole, is the P&L realized from this trade on this day only.
Finally, when we close a trade that has been open:
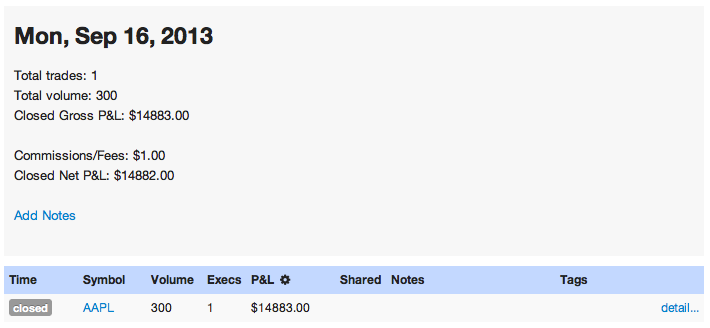
The left column shows “closed”. The P&L shown here is the P&L realized for this day only; it is not the total closed P&L for the trade (that total is shown on the Trades View, and the trade detail).
In a nutshell, the Journal View breaks things down by day, and every day you touch a trade you’ll see an entry there, showing what happened and the realized P&L for that date. You can make notes on each of those days if you wish, and you can see how your P&L for a trade was realized throughout the trade’s lifetime.
The Dashboard will show the same opened/adjusted/closed data as the Journal View, except just for the most recent trading day.
Reports
The Overview reports now show data differently:
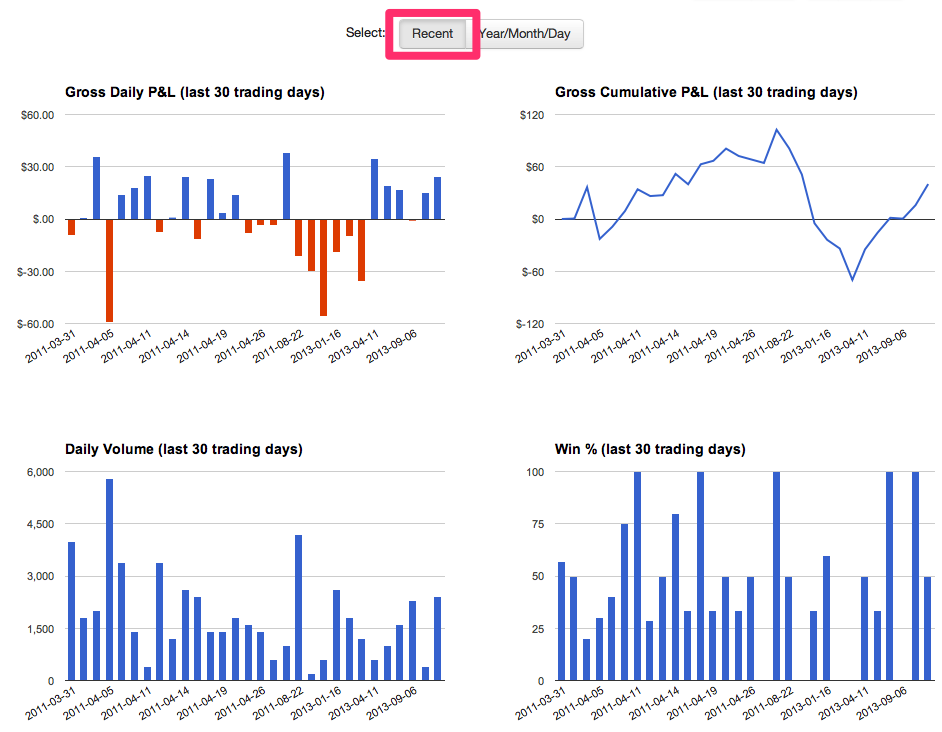
In the Recent report group, the Gross Daily P&L and Gross Cumulative P&L will now show P&L as it is realized, as opposed to on the entry date of the trade. The Daily Volume report will now show volume on the day it occurred. The Win % is based on the trade entry date.
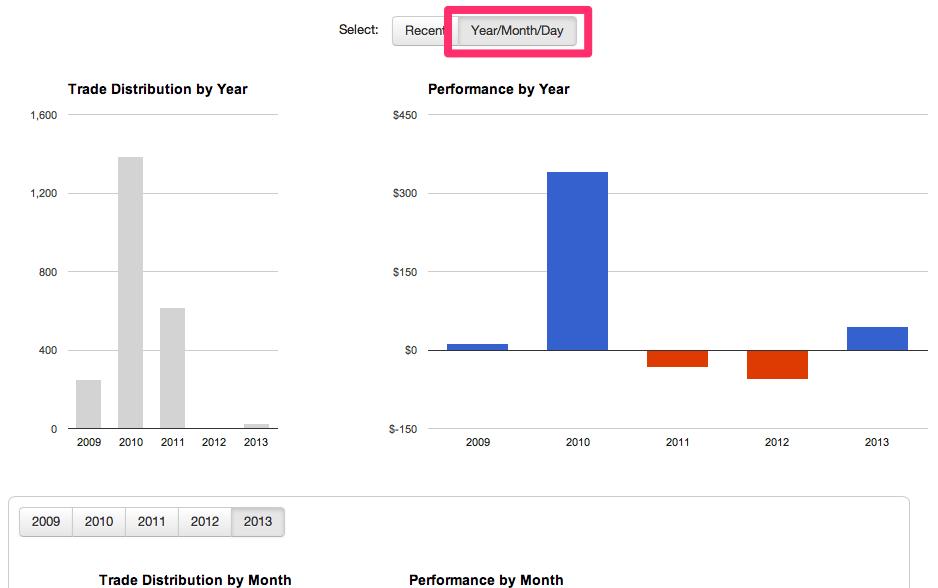
On the Year/Month/Day report group, all P&L is now shown on the date it was realized.
The Detailed reports use the trade entry date for their calculations, with the exception of the Cumulative P&L and Cumulative Drawdown (in the Win/Loss/Expectation group), which use realized dates. The Win vs Loss Days and Compare reports are calculated in a similar manner to the Detailed reports.
Advanced reports use the trade entry date, in cases where a date is relevant.
Currency Conversions
For trades that are settled in other than USD (e.g. Forex and Eurex futures), Tradervue calculates P&L in the native currency, and then converts to USD for reporting. In the past, this conversion would be done using the exchange rate at the time of the closing execution of the trade. Now, each time there is realized P&L in a trade (e.g. each execution in the closing direction), the exchange rate will be determined as of that execution time.
In the case of long-running trades, during which the exchange rate may move considerably, this improves the overall conversion accuracy for the trade.


