
Tradervue now supports importing trades from Scotia iTrade. To import your trades, click on Import Trades, select Scotia iTrade from the list, and follow the instructions!
Monthly Archives: April 2014
Trend report additions – MFE/MAE
We’ve added some additional statistics to the new trend reports that were launched a couple of weeks ago. Specifically:
- Position MFE, Position MAE – the max favorable/adverse excursion of a trade’s total position value
- Price MFE, Price MAE – the max favorable/adverse excursion of the instrument price during a trade, independent of position size
These new additions can surface some interesting trends in your trading. For example, here’s a 100-trade moving average of Position MAE:
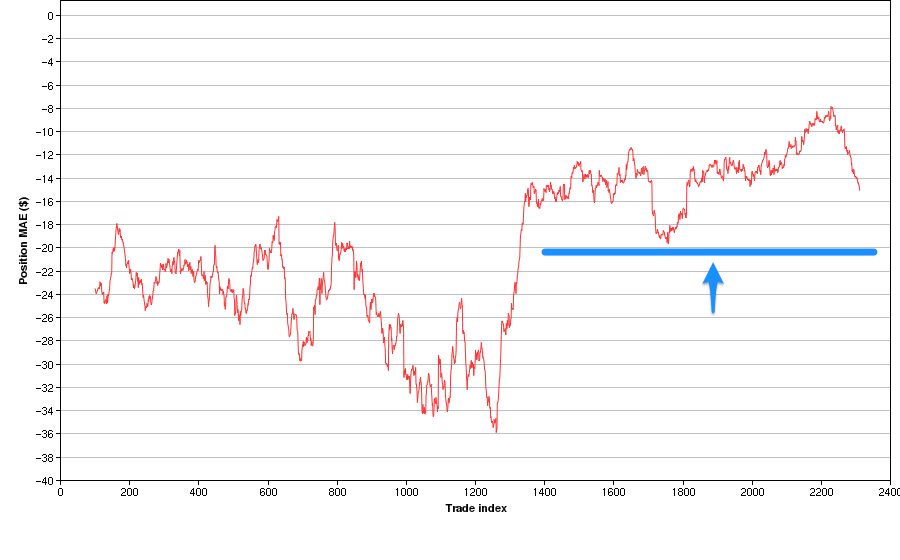
The blue line isn’t part of the chart – it’s just there to help illustrate that at this point, we changed our trading methodology such that trades were given a maximum of about $20 of room to move against us; another way to say this is we tightened our average stops to something less than $20.
Now let’s look at the Position MFE moving average chart:
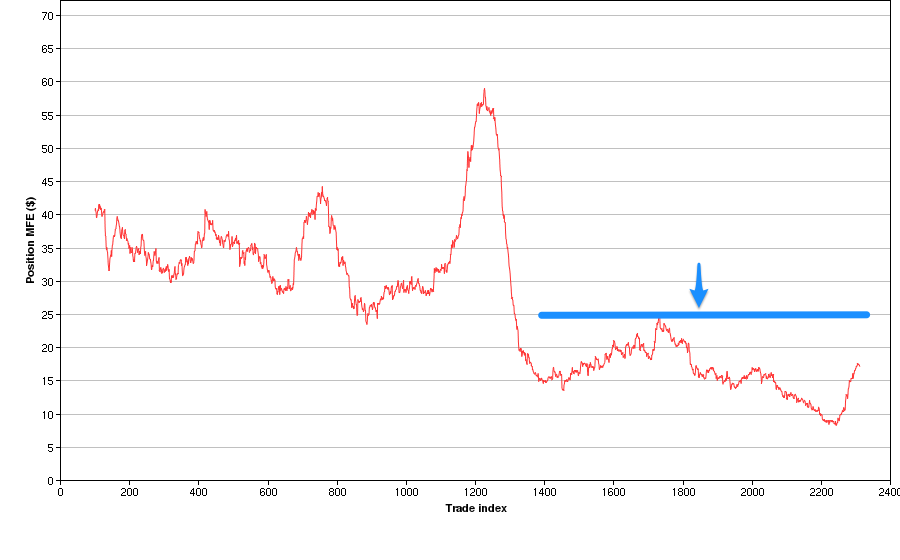
We can now see that at the same time, it seems we no longer let our trades run in the positive direction. Whereas before this change, our stops were looser, but we also let trades run up about $25-60 before closing them; after the change, trades were usually cut after reaching a max P&L of $25.
Another tool in your chest to help evaluate your trading performance!