
On the statistics tables (in the Reports View, on the Detailed, Win vs Loss Days, and Compare tabs), we have added four new statistics:
- Average trade gain/loss
- Average winning trade
- Average losing trade
- Trade P&L standard deviation
The first three are self-explanatory; these were actually available before in the Win/Loss/Expectation sub-group, but they are important enough that we have moved them up into the statistics tables.
The standard deviation is new. It’s not complex – we’re just taking the standard deviation of the P&L for all trades matching the current filter – but it can show some interesting things about your trading. For example, suppose we have:
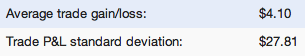
Here, our average trade P&L is $4.10, but our standard deviation is a whopping $27.81 – almost 7 times the average. This suggests that our performance with these trades might well be little more than luck.
Now let us consider:
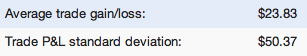
In this case, the average is much higher in relation to the standard deviation, and thus our performance on this set of trades is likely more statistically significant.
These stats can of course be used with other reporting features. A couple of examples to get started with:
- Show standard deviation in R instead of $ using the new risk reports
- Compare these stats for two different trading systems using the Compare reports
These new statistics are available today for all users!