Commission and Fee support

With the latest release this week, Tradervue now supports tracking and reporting commissions and fees for Gold subscribers.

If you’re using one of the brokers/platforms that includes commission/fee data in the data they export, then Tradervue will now automatically import that data.

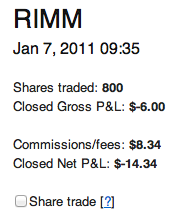
When you’re viewing an individual trade, you’ll see a new summary:
And the execution detail will show the specific costs for each execution in the trade:

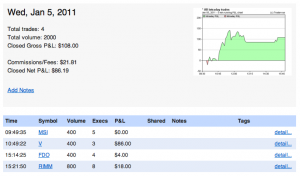
On the Journal view, the per-day summary data will now include the commission/fee data as well:

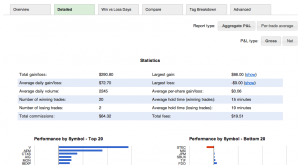
The reports also include commissions and fees in the summary data. And each report now has a new setting (on the right side of the screen shot) allowing you to switch between Gross and Net P&L for that report:

If your broker or platform does not include commission data, you can use commission estimates. On your Settings page (you can get here from the Dashboard, or click on your user name in the top right of the screen), click the “Trade Settings” tab, and you will see a “Commission settings” section. Enter your per-share and per-contract commissions, and when you’re importing data that does not include commissions, these values will be used:

It’s quite striking what a difference it makes seeing your actual trading costs when looking at your performance – I encourage you to take a look!

Big update today, including new subscription plans

We’ve launched a ton of new features today, along with rolling out new silver and gold subscription plans with even more great features. Among the new additions:

  • New reports! A P&L overview, performance by tag, detailed views of performance by trade duration and other dimensions. And even a new report of performance by market day type (e.g. trend day, range day, etc.).
  • Commission and Fee Tracking. One of the most-requested features since the launch is now available!
  • Chart studies and comparisons. You’ve already had auto-generated price charts; now, you can add studies such as moving averages, MACD, bollinger bands, and many more to your charts. Plus, you can add another symbol to your charts for comparison purposes.
  • Dashboard. A new dashboard will greet you when you log in, helping you see at a glance what’s happening with your recent trading.
  • Import preferences. You can now tweak the trade grouping behavior that is used when you import your trades. If you’re one of the folks who splits or merges all of their trades every day, this can now be automated to save you some time.

I’ll add posts here over the next few days detailing all of these new features…but in the meantime, head on over to Tradervue and start seeing how it could improve your trading performance!